How to Create and Analysis Garphs with ChatGPT Easily and Quickly
- Name
- Nikki Lopez
Published on
OpenAI's ChatGPT is a transformative force in the world of artificial intelligence. Its applications span various domains, but one area where it's making significant strides is in the creation and interpretation of graphs. This article explores how ChatGPT is revolutionizing the world of graphs, shedding light on its potential and practical uses.
Create Graphs with ChatGPT: New Tools for Analysis
ChatGPT, a sibling model to InstructGPT, is trained to follow instructions in a prompt and provide detailed responses. It's an AI tool that has transformed how we write and code, taking a question and returning an answer in a very human-sounding way. But its capabilities extend beyond just text generation.
Interaction with Graph Databases
One of the most impressive features of ChatGPT is its ability to interact with graph databases. This capability allows it to process natural language queries from users and translate them into graph database queries. This makes it easier for users to search for information, as they can do so using plain language.
Graph Creation and Analysis with ChatGPT
ChatGPT's interaction with graph databases also enables it to create and analyze graphs. Users can instruct ChatGPT to generate a graph, and the AI will produce a script, often in a language like Mermaid, which can be copied and pasted into an editor to generate the graph. This feature is particularly useful for users who want to create graphs but lack the technical skills to do so.
Graphing Analysis with ChatGPT: Everything Made Simple
Graphs play a crucial role in data analysis, allowing complex data to be understood quickly and easily. They provide a visual representation of data, making patterns, trends, and outliers more apparent. However, creating and interpreting graphs can be a complex task, which is where ChatGPT comes into play.
Simplifying Graph Creation with ChatGPT
Creating graphs with ChatGPT is a straightforward process. It involves instructing the AI in a specific manner to generate the desired graph. For instance, to create a bar graph, you would instruct ChatGPT to generate a bar graph with specific parameters such as the x-axis, y-axis, and the data points. The AI then generates a script, often in a language like Mermaid, which can be copied and pasted into an editor to generate the graph.
Interpreting Graphs with Ease using ChatGPT
ChatGPT is not only capable of creating graphs but also interpreting them. It can read the data points, understand the patterns and trends, and provide a summary of the information presented in the graph. This capability can be incredibly useful in data analysis, where interpreting graphs can often be a complex and time-consuming task.
VizGPT: Easily Create Graphs with the Power of ChatGPT
VizGPT is an innovative tool that allows you to make contextual data visualizations from tabular datasets using a chat interface. It takes the capabilities of ChatGPT a step further by allowing you to build visualizations step by step, edit and adjust them in context, and explore the data first without having to figure out how to build complex visualizations initially. This is especially useful when you're unfamiliar with the data.
ChatGPT-powered Graphs Building
With VizGPT, you can ask questions like "Show the distribution of Miles per Gallon" or "How does Miles per Gallon differ in Year?" and the tool will generate an appropriate visualization. You can even ask it to recommend a random chart from the dataset.
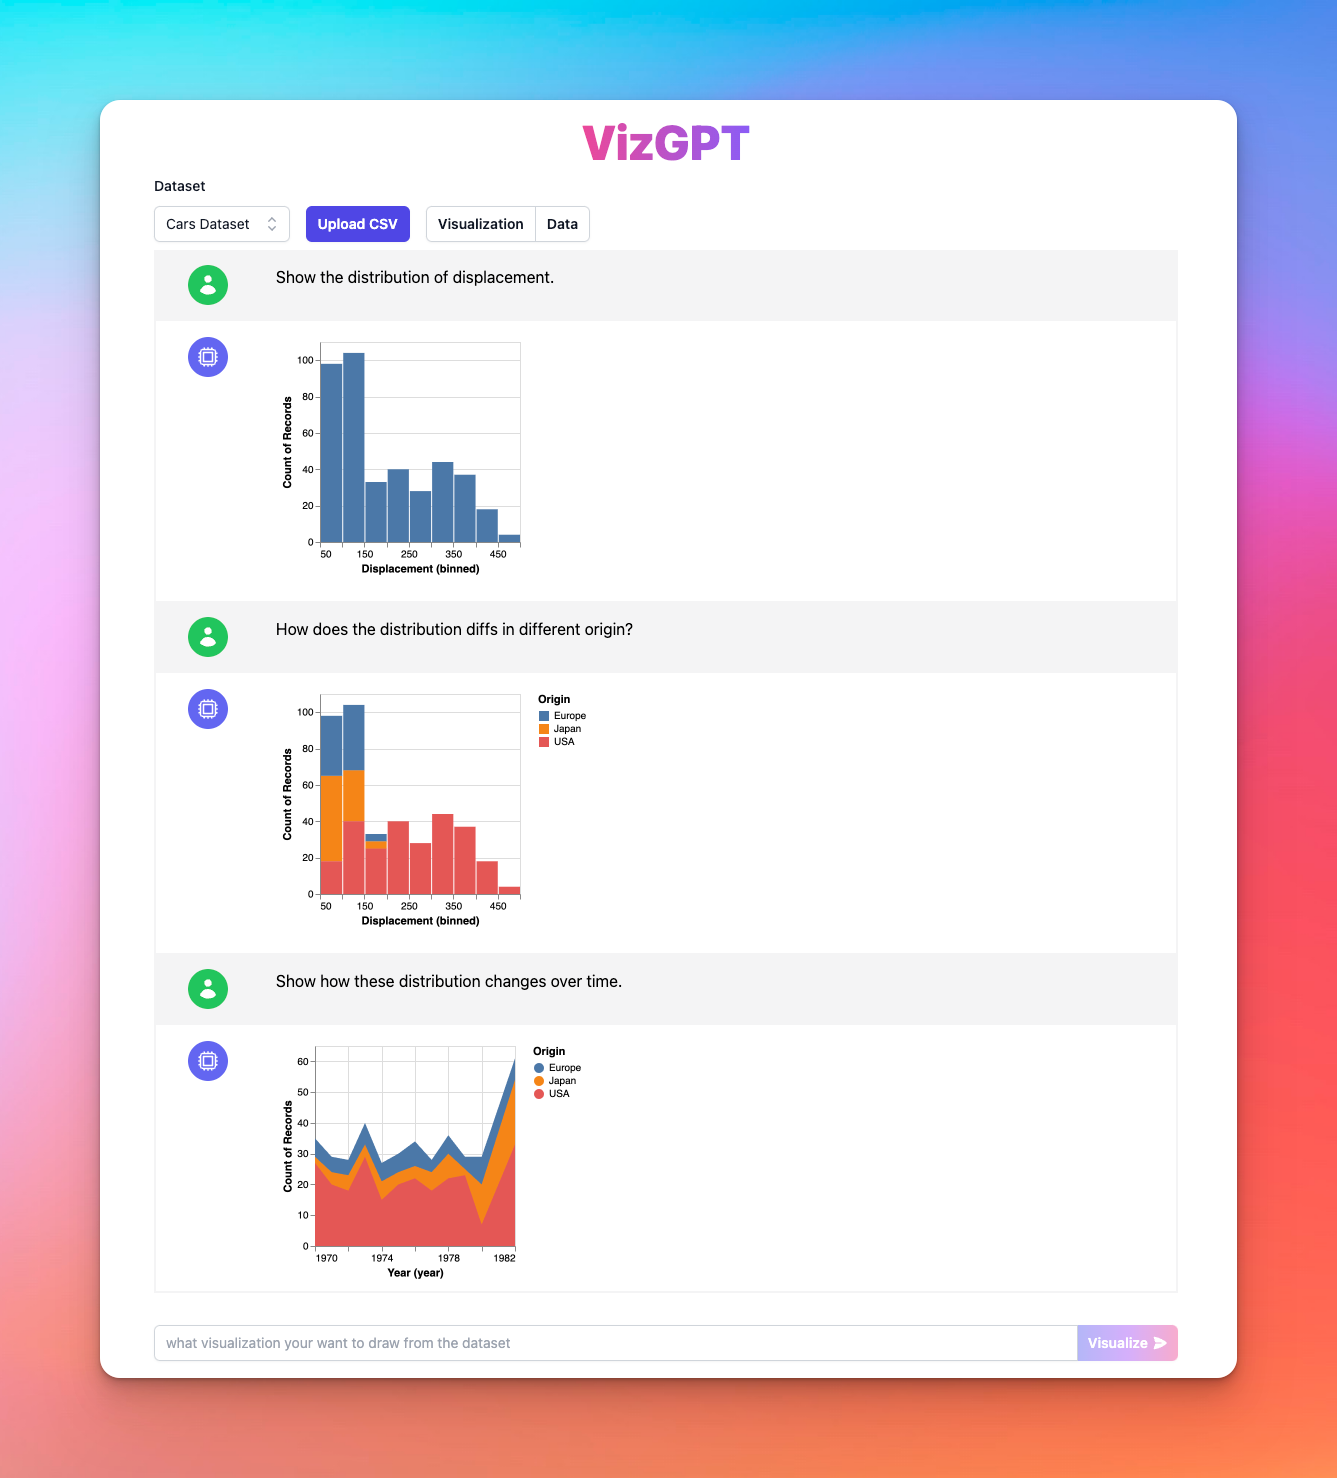
For example, if you're working with a dataset about car models and their fuel efficiency, you could ask VizGPT, "Show me a histogram of the Miles per Gallon." VizGPT would then generate a histogram that accurately represents the distribution of Miles per Gallon for the car models in your dataset.
Editing and Adjusting Graphs in Context
One of the standout features of VizGPT is its ability to allow users to edit and adjust visualizations in context. This means you can make changes to your graph or chart directly within the chat interface. For example, if you want to change the color of a bar in your bar graph or adjust the scale of your y-axis, you can do so directly within the chat interface. This feature makes it incredibly easy to tweak your visualizations until they perfectly represent your data.
Imagine you've created a bar graph that represents the sales of different products in your company. However, you realize that the colors of the bars are too similar, making it hard to distinguish between them. With VizGPT, you can simply ask, "Change the color of the bars to a gradient of blue," and the tool will adjust the colors accordingly.
So why wait? Check out VizGPT and try it out (opens in a new tab) now!
Interested? Visit VizGPT Website (opens in a new tab) to try it out now!

Ways You Can Make Graphs with ChatGPT
ChatGPT's capabilities extend beyond simple graph creation and interpretation. It can also be used for more advanced graphing techniques.
Generating Diagrams Using SVG Code
For instance, it can generate diagrams using SVG code, allowing for more complex and detailed graphs. This feature is particularly useful for users who want to create intricate diagrams that go beyond the capabilities of standard graphing tools.
Interacting with Various Graphing Libraries and Tools
ChatGPT can also interact with various graphing libraries and tools, such as ggplot, to create more sophisticated graphs. This means that users can leverage the power of these libraries and tools directly within the ChatGPT interface, making it easier than ever to create stunning and informative graphs.
 (Source: Reddit (opens in a new tab))
For instance, let's say you want to create a line chart with two data series trended over time using ggplot. You can simply ask ChatGPT to do so, and it will generate the necessary code for you. Here's an example of how it works:
User: "Create a line chart with two data series trended over time, using ggplot2" ChatGPT: "To create a line chart with two data series trended over time using ggplot2, you can use the following code:
library(ggplot2)
# Create a data frame with the two data series
df <- data.frame(time = 1:10, series1 = rnorm(10), series2 = rnorm(10))
ggplot(df, aes(time)) +
  geom_line(aes(y = series1), color = 'blue') +
  geom_line(aes(y = series2), color = 'red')
This will create a line chart with two data series trended over time."
This interaction shows how ChatGPT can generate code for creating a graph using ggplot2, a popular graphing library in R. The user can then take this code, run it in their R environment, and get the graph they asked for.
The Future of ChatGPT and Graphs
The capabilities of ChatGPT in relation to graphs are vast and varied. From creating simple bar graphs to interacting with graph databases and generating complex diagrams, ChatGPT is revolutionizing the field of graph creation and interpretation. As AI technology continues to evolve, we can expect to see even more advanced capabilities from ChatGPT and similar models.
The potential applications are limitless, from business intelligence and data analysis to education and research. With the power of AI, complex tasks like graph creation and interpretation are becoming easier and more accessible to everyone.
FAQ
1. How do you paste a graph in ChatGPT?
ChatGPT doesn't natively support the pasting of graphical or image data. It primarily interacts with text-based inputs and outputs. However, you can describe a graph in text form to ChatGPT, and it can generate responses based on that description.
2. What is ChatGPT's capability in graph analysis?
ChatGPT can interpret descriptions of graphs provided in text form. For example, if you describe the data points, trends, and patterns of a graph, ChatGPT can provide an analysis or summary based on that description. However, as of my last training data in September 2021, it doesn't directly analyze graphical or image data.
3. Can ChatGPT generate graphs?
Yes, ChatGPT can generate scripts (often in a language like Mermaid) that can be used to create a variety of graphs, including bar graphs, line graphs, and pie charts. These scripts can be copied and pasted into an appropriate editor or tool to generate the graph.
4. Can ChatGPT interpret graphs?
ChatGPT can interpret descriptions of graphs provided in text form. It can read the data points, understand the patterns and trends, and provide a summary of the information presented in the graph. However, as of my last training data in September 2021, it doesn't directly interpret graphical or image data.