How to Merge, Join and Concat Pandas DataFrames in Python
Published on

Merging, joining, and concatenating DataFrames in pandas are important techniques that allow you to combine multiple datasets into one. These techniques are essential for cleaning, transforming, and analyzing data. Merging, joining, and concatenating are often used interchangeably, but they refer to different methods of combining data. In this post, we will discuss these three important techniques in detail and provide examples of how to use them in Python.
Merging DataFrames in Pandas
Merging is the process of combining two or more DataFrames into a single DataFrame by linking rows based on one or more common keys. The common keys can be one or more columns that have matching values in the DataFrames being merged.
Different Types of Merges
There are four types of merges in pandas: inner, outer, left, and right.
- Inner Merge: Returns only the rows that have matching values in both DataFrames.
- Outer Merge: Returns all the rows from both DataFrames and fills in the missing values with NaN where there is no match.
- Left Merge: Returns all the rows from the left DataFrame and the matching rows from the right DataFrame. Fills in the missing values with NaN where there is no match.
- Right Merge: Returns all the rows from the right DataFrame and the matching rows from the left DataFrame. Fills in the missing values with NaN where there is no match.
Examples of How to Perform Different Types of Merges
Let's look at some examples of how to perform different types of merges using Pandas.
Example 1: Inner Merge
import pandas as pd

# Creating two DataFrames
df1 = pd.DataFrame({'key': ['A', 'B', 'C', 'D'],
                    'value': [1, 2, 3, 4]})
df2 = pd.DataFrame({'key': ['B', 'D', 'E', 'F'],
                    'value': [5, 6, 7, 8]})

# Inner merge
merged_inner = pd.merge(df1, df2, on='key')

print(merged_inner)
Output:
  key  value_x  value_y
0   B        2        5
1   D        4        6
Example 2: Outer Merge
import pandas as pd

# Creating two DataFrames
df1 = pd.DataFrame({'key': ['A', 'B', 'C', 'D'],
                    'value': [1, 2, 3, 4]})
df2 = pd.DataFrame({'key': ['B', 'D', 'E', 'F'],
                    'value': [5, 6, 7, 8]})

# Outer merge
merged_outer = pd.merge(df1, df2, on='key', how='outer')

print(merged_outer)
Output:
  key  value_x  value_y
0   A      1.0      NaN
1   B      2.0      5.0
2   C      3.0      NaN
3   D      4.0      6.0
4   E      NaN      7.0
5   F      NaN      8.0
Example 3: Left Merge A left merge returns all the rows from the left DataFrame and the matched rows from the right DataFrame. Any rows from the left DataFrame that do not have a match in the right DataFrame will have NaN values in the columns of the right DataFrame.
import pandas as pd

# Create two DataFrames
df1 = pd.DataFrame({'key': ['A', 'B', 'C', 'D'], 'value': [1, 2, 3, 4]})
df2 = pd.DataFrame({'key': ['B', 'D', 'E'], 'value': [5, 6, 7]})

# Perform a left merge
left_merged_df = pd.merge(df1, df2, on='key', how='left')

# Print the merged DataFrame
print(left_merged_df)
Output:
  key  value_x  value_y
0   A        1     NaN
1   B        2     5.0
2   C        3     NaN
3   D        4     6.0
Example 4: Right Merge A right merge returns all the rows from the right DataFrame and the matched rows from the left DataFrame. Any rows from the right DataFrame that do not have a match in the left DataFrame will have NaN values in the columns of the left DataFrame.
import pandas as pd

# Create two DataFrames
df1 = pd.DataFrame({'key': ['A', 'B', 'C'], 'value': [1, 2, 3]})
df2 = pd.DataFrame({'key': ['B', 'D', 'E'], 'value': [5, 6, 7]})

# Perform a right merge
right_merged_df = pd.merge(df1, df2, on='key', how='right')

# Print the merged DataFrame
print(right_merged_df)
Output:
  key  value_x  value_y
0   B      2.0       5
1   D      NaN       6
2   E      NaN       7
Joining DataFrames in pandas
Joining is a method of combining two DataFrames into one based on their index or column values.
There are four types of joins in pandas: inner, outer, left, and right.
- Inner Join: Returns only the rows that have matching index or column values in both DataFrames.
- Outer Join: Returns all the rows from both DataFrames and fills in the missing values with NaN where there is no match.
- Left Join: Returns all the rows from the left DataFrame and the matching rows from the right DataFrame. Fills in the missing values with NaN where there is no match.
- Right Join: Returns all the rows from the right DataFrame and the matching rows from the left DataFrame. Fills in the missing values with NaN where there is no match.
Concatenating DataFrames in pandas
Concatenating is the process of joining two or more DataFrames either vertically or horizontally. In pandas, this can be achieved using the concat() function. The concat() function allows you to combine two or more DataFrames into a single DataFrame by stacking them either vertically or horizontally.
Examples of how to concatenate two or more DataFrames using pandas
To concatenate two or more DataFrames vertically, you can use the following code:
import pandas as pd

# Create two sample DataFrames
df1 = pd.DataFrame({'A': ['A0', 'A1', 'A2', 'A3'],
                    'B': ['B0', 'B1', 'B2', 'B3'],
                    'C': ['C0', 'C1', 'C2', 'C3'],
                    'D': ['D0', 'D1', 'D2', 'D3']})

df2 = pd.DataFrame({'A': ['A4', 'A5', 'A6', 'A7'],
                    'B': ['B4', 'B5', 'B6', 'B7'],
                    'C': ['C4', 'C5', 'C6', 'C7'],
                    'D': ['D4', 'D5', 'D6', 'D7']})

# Concatenate the DataFrames vertically
result = pd.concat([df1, df2])

print(result)
Output:
    A   B   C   D
0  A0  B0  C0  D0
1  A1  B1  C1  D1
2  A2  B2  C2  D2
3  A3  B3  C3  D3
0  A4  B4  C4  D4
1  A5  B5  C5  D5
2  A6  B6  C6  D6
3  A7  B7  C7  D7
To concatenate two or more DataFrames horizontally, you can use the following code:
import pandas as pd

# Create two sample DataFrames
df1 = pd.DataFrame({'A': ['A0', 'A1', 'A2', 'A3'],
                    'B': ['B0', 'B1', 'B2', 'B3'],
                    'C': ['C0', 'C1', 'C2', 'C3'],
                    'D': ['D0', 'D1', 'D2', 'D3']})

df2 = pd.DataFrame({'E': ['E0', 'E1', 'E2', 'E3'],
                    'F': ['F0', 'F1', 'F2', 'F3'],
                    'G': ['G0', 'G1', 'G2', 'G3'],
                    'H': ['H0', 'H1', 'H2', 'H3']})

# Concatenate the DataFrames horizontally
result = pd.concat([df1, df2], axis=1)

print(result)
Output:
    A   B   C   D   E   F   G   H
0  A0  B0  C0  D0  E0  F0  G0  H0
1  A1  B1  C1  D1  E1  F1  G1  H1
2  A2  B2  C2  D2  E2  F2  G2  H2
Create Concat View for Panda Dataframes
For creating Concat Views within Python, there is an Open Source Data Analysis & Data Visualization package that can get you covered: PyGWalker (opens in a new tab).

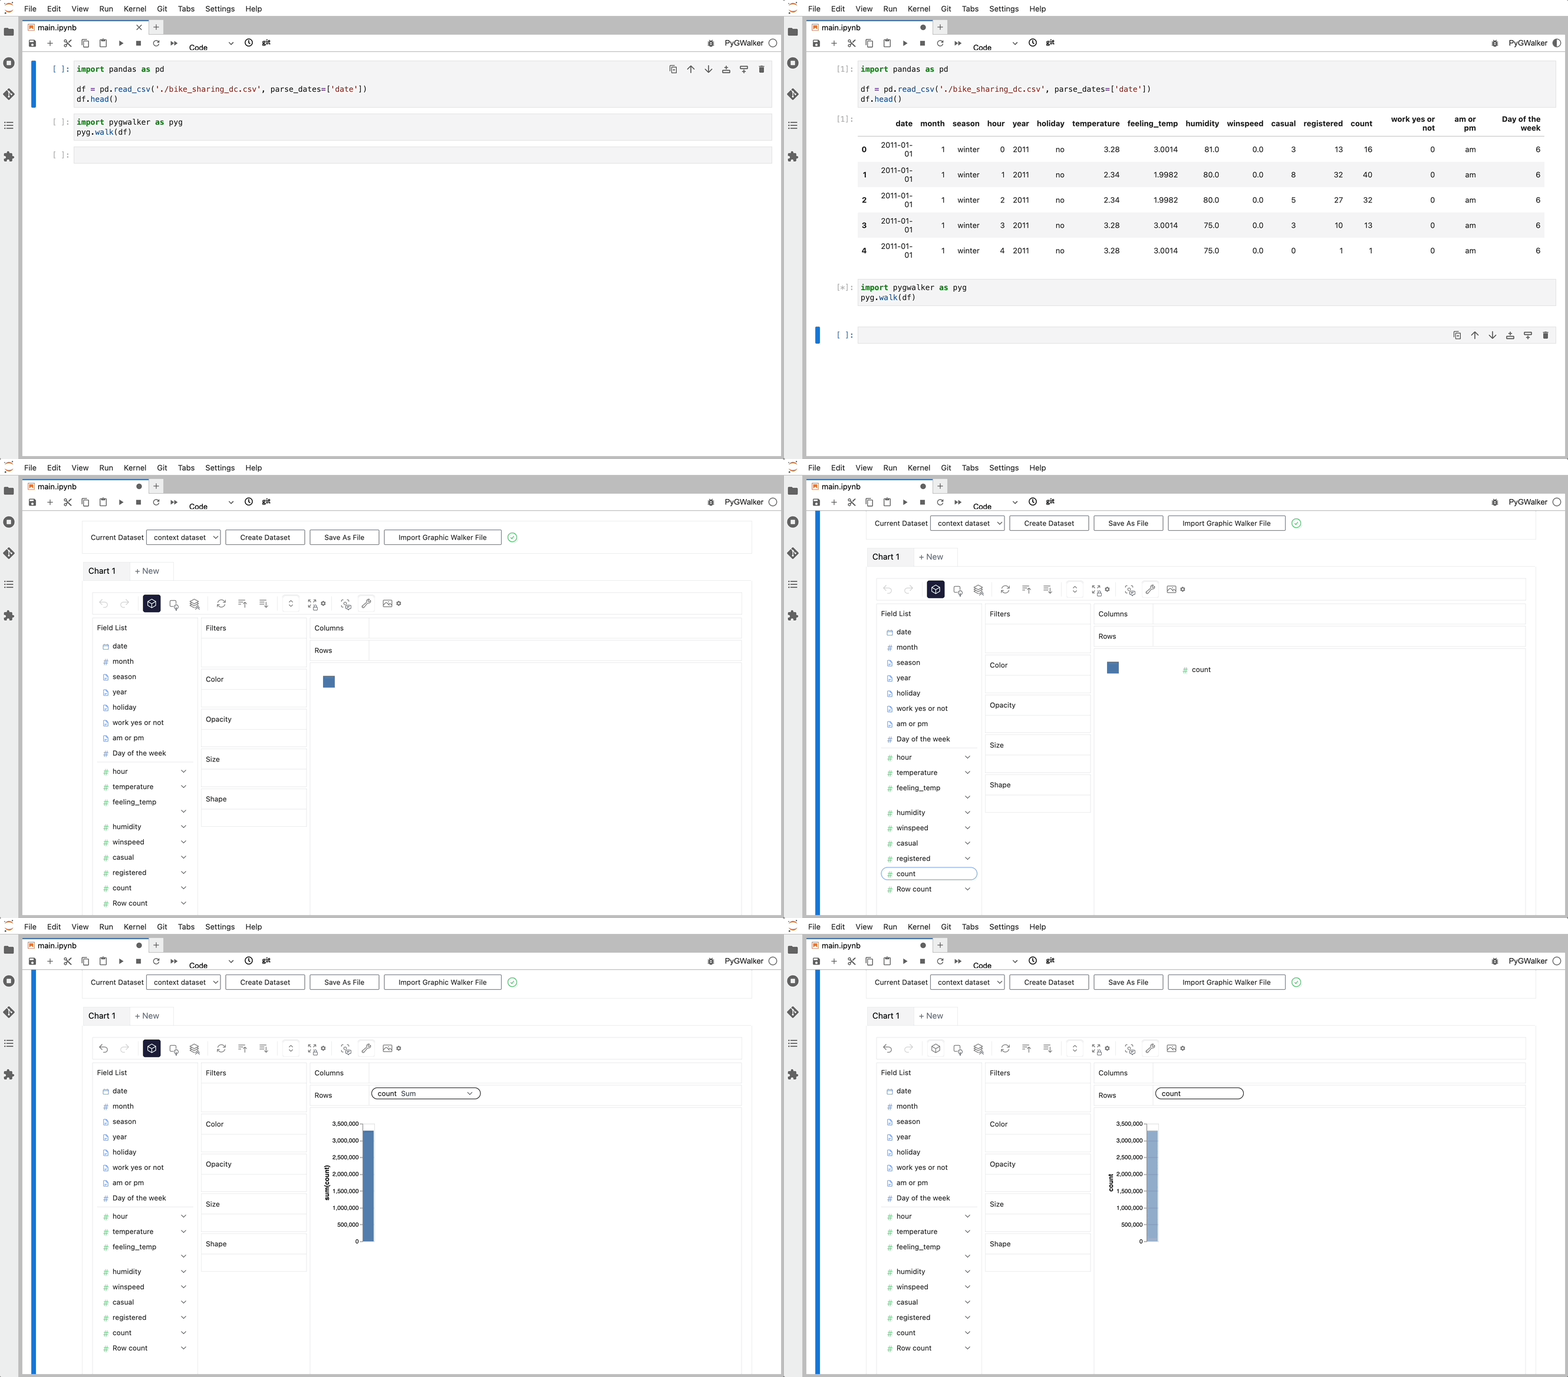
PyGWalker can simplify your Jupyter Notebook data analysis and data visualization workflow. By bringing a lightweight, easy-to-use interface instead of analyzing data using Python. The steps are easy:
Import pygwalker and pandas to your Jupyter Notebook to get started.
import pandas as pd
import pygwalker as pyg
You can use pygwalker without changing your existing workflow. For example, you can call up Graphic Walker with the dataframe loaded in this way:
df = pd.read_csv('./bike_sharing_dc.csv', parse_dates=['date'])
gwalker = pyg.walk(df)
Now you can visualize your Pandas Dataframe with a user-friendly UI!
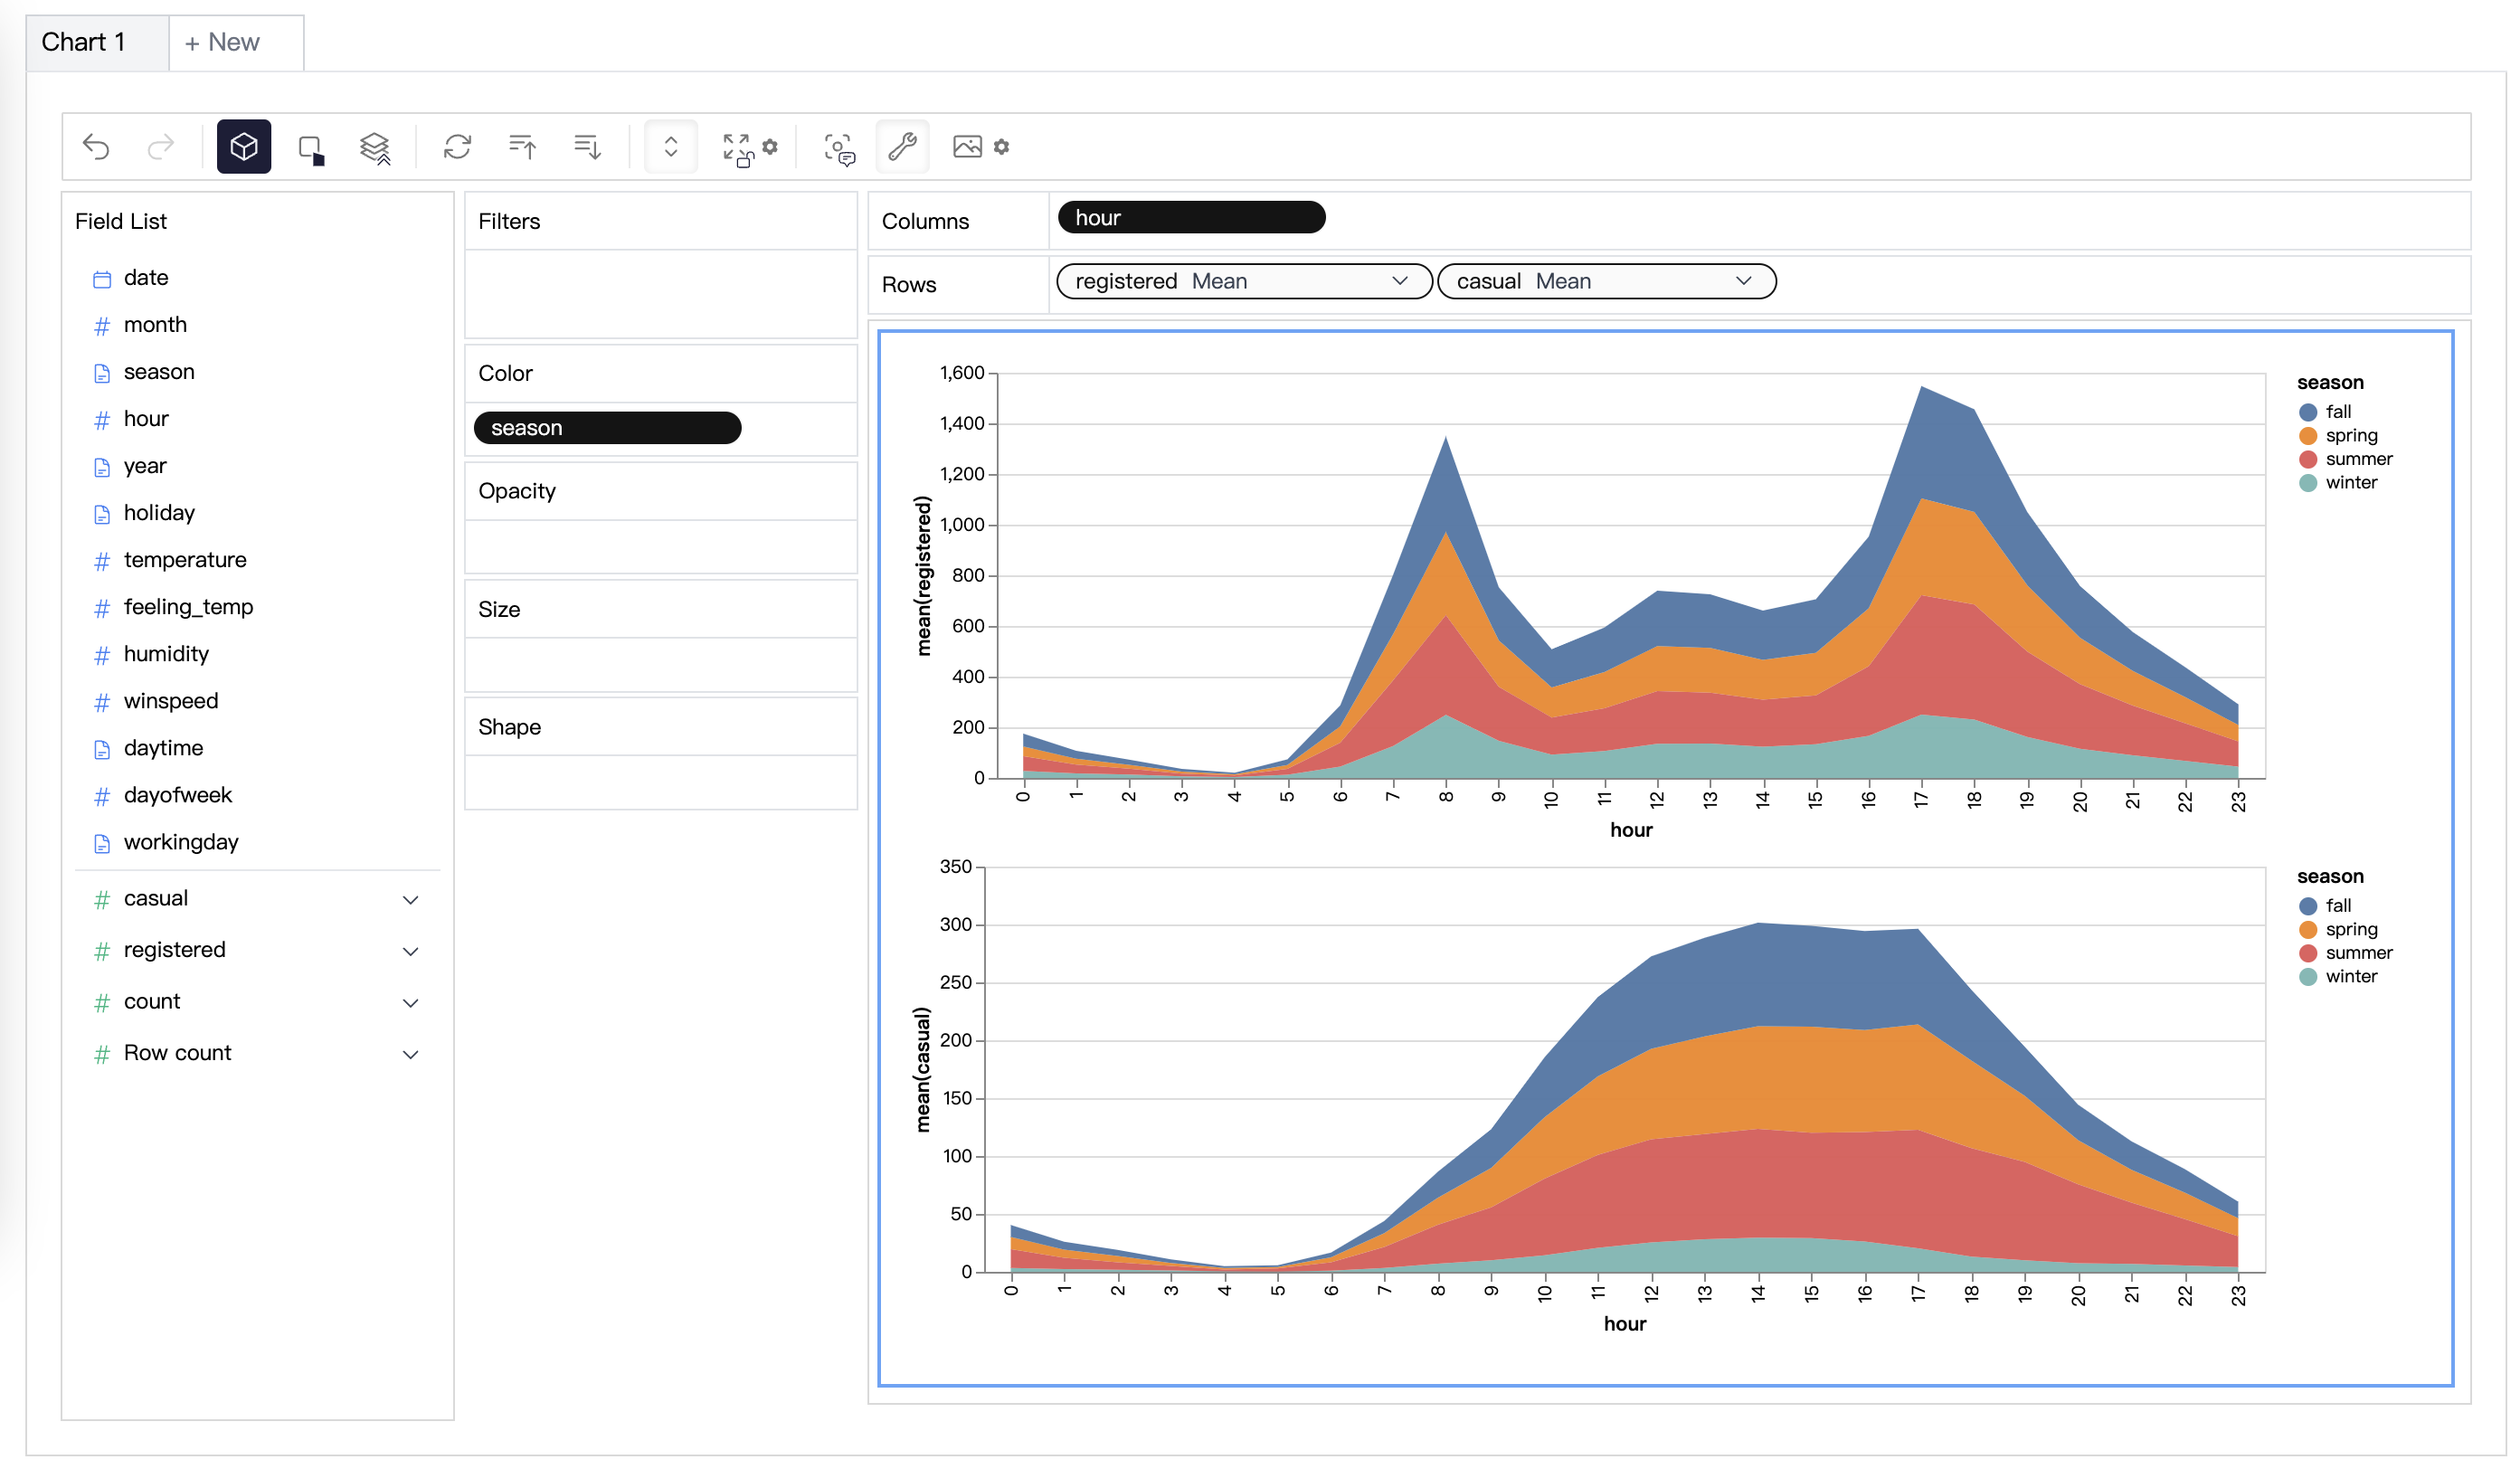
You can simply create a Concat View by dragging and dropping variables:
To test out PyGWalker right now, you can run PyGWalker in Google Colab (opens in a new tab), Binder (opens in a new tab) or Kaggle (opens in a new tab).
PyGWalker is Open Source. You can check out PyGWalker GitHub page (opens in a new tab) and read the Towards Data Science Article (opens in a new tab) of it.
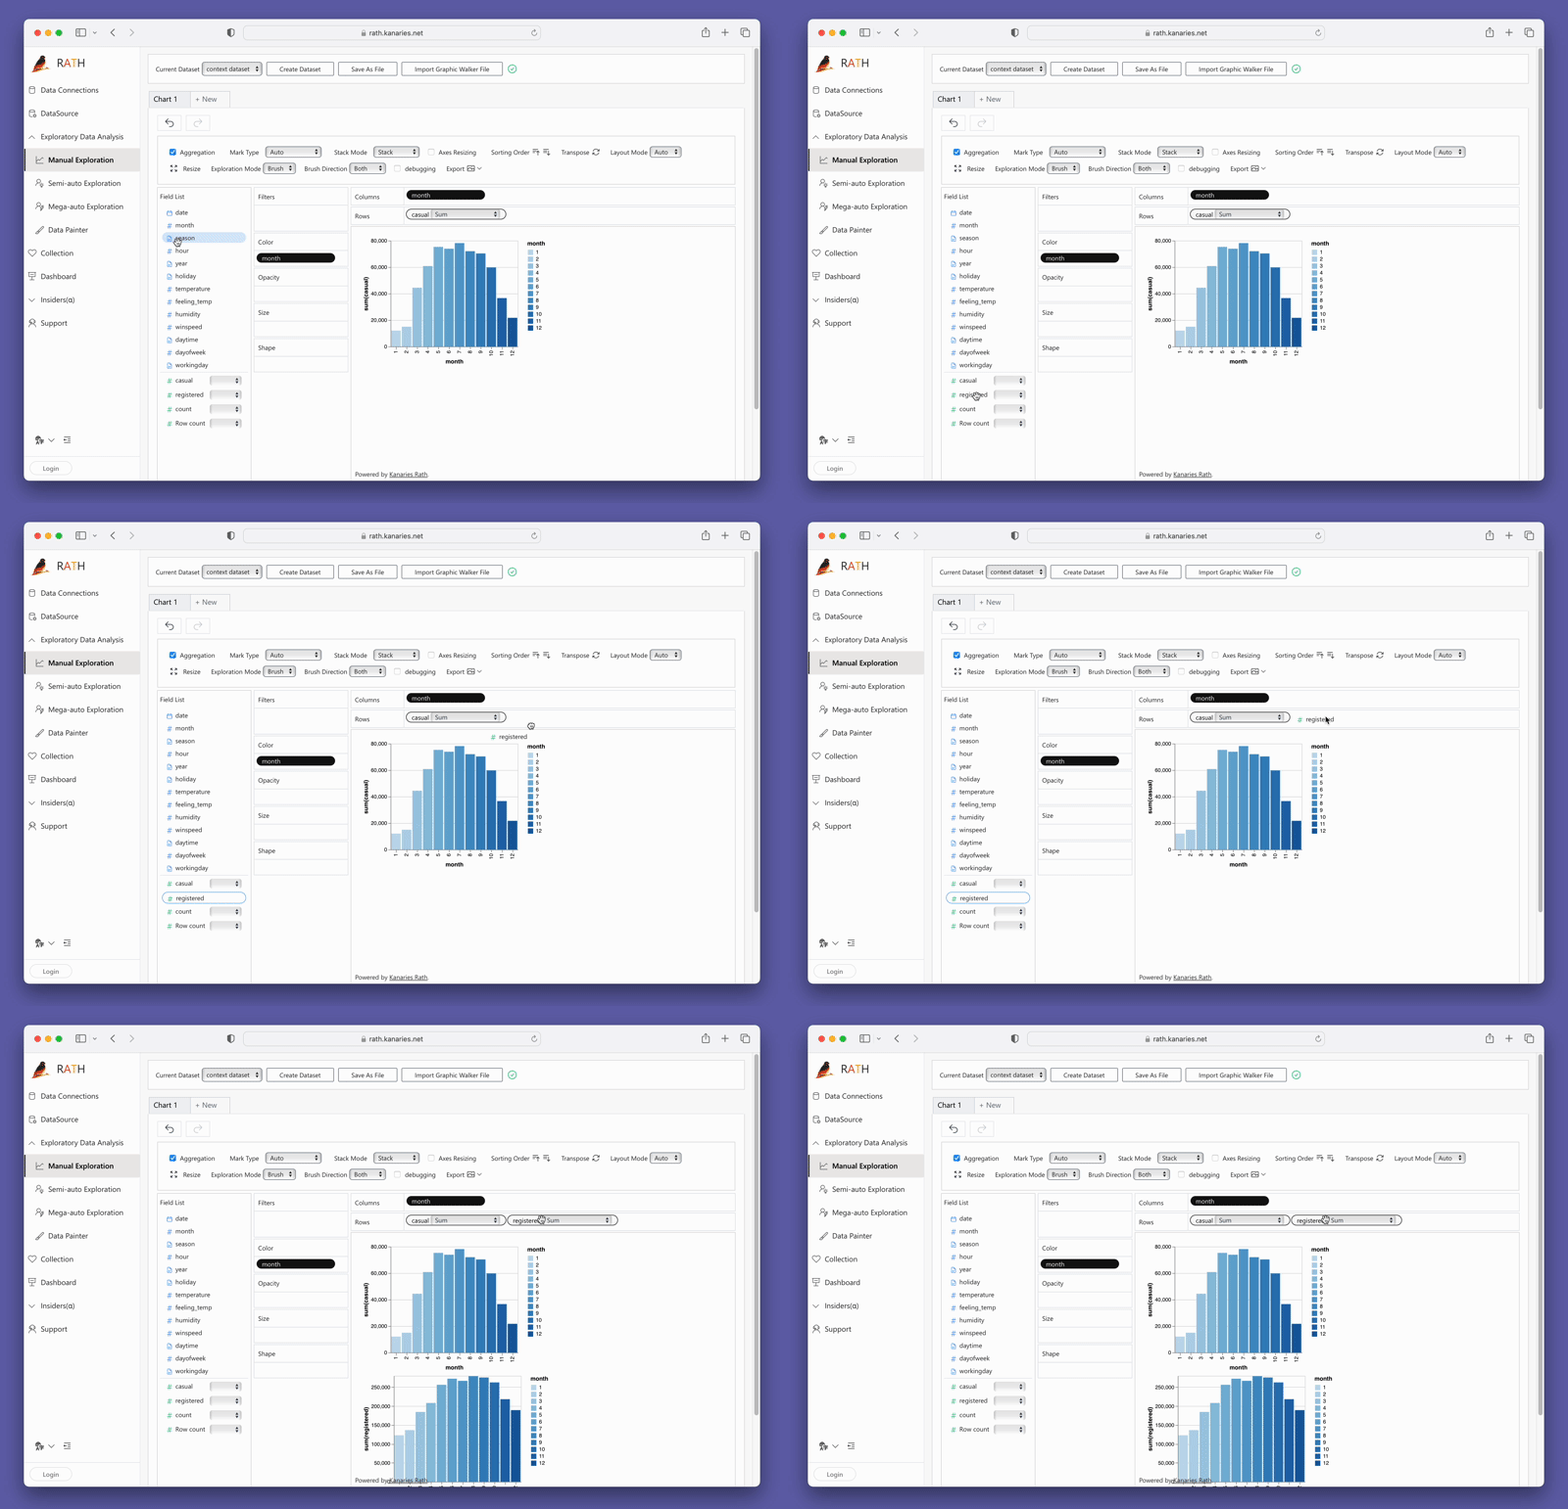
Don't forget to check out a more advanced, AI-empowered Automated Data Analysis tool: RATH (opens in a new tab). RATH is also open-sourced and hosted its source code on GitHub (opens in a new tab).
FAQ
How can I join two DataFrames using it?
PySpark is an open-source big data processing framework that allows you to write data processing applications in Python, Java, Scala, or R. To join two DataFrames using PySpark, you can use the join() method, which takes two DataFrame objects and an optional join expression. You can specify the type of join using the how parameter.
# import PySpark library and create SparkSession
from pyspark.sql import SparkSession
spark = SparkSession.builder.appName("JoinExample").getOrCreate()

# create two DataFrames
df1 = spark.createDataFrame([(1, 'A'), (2, 'B'), (3, 'C')], ['id', 'letter'])
df2 = spark.createDataFrame([(1, 'X'), (2, 'Y'), (3, 'Z')], ['id', 'symbol'])

# join the two DataFrames using PySpark
joined_df = df1.join(df2, 'id', 'inner')

# show the resulting DataFrame
joined_df.show()
How can I merge two DataFrames using R?
To merge two DataFrames using R, you can use the merge() function, which takes two data frames and an optional set of arguments that specify how the data should be merged.
# create two data frames
df1 <- data.frame(id = c(1, 2, 3), letter = c("A", "B", "C"))
df2 <- data.frame(id = c(1, 2, 4), symbol = c("X", "Y", "Z"))

# merge the two data frames using R
merged_df <- merge(df1, df2, by = "id", all = TRUE)

# show the resulting data frame
print(merged_df)
How can I append two or more DataFrames in pandas?
To append two or more DataFrames in pandas, you can use the concat() function, which takes a list of DataFrames and an optional axis parameter that specifies the axis along which the DataFrames should be concatenated.
# import pandas library
import pandas as pd

# create two DataFrames
df1 = pd.DataFrame({'id': [1, 2, 3], 'letter': ['A', 'B', 'C']})
df2 = pd.DataFrame({'id': [4, 5, 6], 'letter': ['D', 'E', 'F']})

# append the two DataFrames using pandas
appended_df = pd.concat([df1, df2], ignore_index=True)

# show the resulting DataFrame
print(appended_df)
How can I join two DataFrames based on a common column using pandas?
To join two DataFrames based on a common column using pandas, you can use the merge() function, which takes two DataFrames and an optional set of arguments that specify how the data should be merged. You can specify the column to join using the on parameter.
# create two DataFrames
df1 = pd.DataFrame({'id': [1, 2, 3], 'letter': ['A', 'B', 'C']})
df2 = pd.DataFrame({'id': [1, 2, 4], 'symbol': ['X', 'Y', 'Z']})

# join the two DataFrames using pandas
joined_df = pd.merge(df1, df2, on='id', how='inner')

# show the resulting DataFrame
print(joined_df)
Conclusion
In conclusion, merging, joining, and concatenating DataFrames are essential operations in data analysis. With the help of powerful tools like pandas, PySpark, and R, these operations can be performed easily and efficiently. Whether you are dealing with large or small datasets, these tools offer flexible and intuitive ways to manipulate your data.

