Top 10 Open-Source Tools for Data Analysis and Visualization in 2023

Data Analysis and Data Visualization are crucial components of any data-driven organization. The ability to quickly and efficiently extract insights from data is essential for making informed decisions and driving business growth. In recent years, open-source software has become increasingly popular for data analysis, as it offers a cost-effective and flexible alternative to proprietary tools. In this article, we will take a look at some of the best open-source software options for data analysts in 2023.
List of 10 Open-Source Data Analysis Tools
RATH
RATH is an open-source Automated data exploratory analysis and visualization tool. It goes beyond an open-source alternative to Data Analysis and Visualization tools such as Tableau. It automates your Exploratory Data Analysis workflow with an Augmented Analytic engine by discovering patterns, insights, and causals and presents those insights with powerful auto-generated multi-dimensional data visualization.
For users with a more traditional BI background, RATH has an easy-to-use, Tableau-like feature called Manual Exploration. You can create highly customizable charts (opens in a new tab) by dragging and dropping variables to shelves. Watch the following demo video about Exploring the seasonal relationships between registered users and casual users.
Discovering the underlying patterns and trends from a complicated data source can be extremely challenging. The Data Painter (opens in a new tab) feature is designed to fix this problem. You can easily clean data, model data, and explore data using a Painting Tool, which turns the complex Exploratory Data Analysis process visual and simple.
The following demo video shows the process of finding out the meaning of the trend within a certain data set:
RATH supports a wide range of data sources (opens in a new tab). Here are some of the major database solutions that you can connect to RATH: MySQL, ClickHouse, Amazon Athena, Amazon Redshift, Apache Spark SQL, Apache Doris, Apache Hive, Apache Impala, Apache Kylin, Oracle, Snowflake, Google BigQuery and PostgreSQL.
RATH (opens in a new tab) is Open Source. Visit RATH GitHub and experience the next-generation Auto-EDA (opens in a new tab) tool. You can also check out the RATH Online Demo as your Data Analysis Playground!

R
R (opens in a new tab) is a powerful programming language and software environment for data analysis. It is widely used in the statistical and data science communities and offers a wide range of packages for data manipulation, visualization, and statistical modeling. R is particularly well-suited for complex data analysis tasks, such as machine learning and predictive modeling.
Python
Python (opens in a new tab) is a versatile programming language that is widely used in data analysis and scientific computing. It offers a wide range of libraries and packages for data manipulation, visualization, and machine learning, such as NumPy, pandas, and scikit-learn. Additionally, Python is easy to learn and has a large and active community, making it a great option for data analysts of all skill levels.
Gnu Octave
Octave (opens in a new tab) is a high-level programming language and numerical computation software that is often used as a free alternative to MATLAB. It offers a wide range of mathematical and statistical functions, as well as visualization capabilities.
KNIME
KNIME (opens in a new tab) is an open-source data analytics and reporting platform that allows users to visually create, execute, and share data workflows. It offers a wide range of pre-built nodes for data manipulation, machine learning, and visualization, making it a powerful tool for data analysts.
Apache Superset
Apache Superset (opens in a new tab) is an open-source data visualization and exploration platform that allows users to create and share interactive dashboards and visualizations. It is built on top of Flask and provides a wide range of visualization options and integration with various data sources.
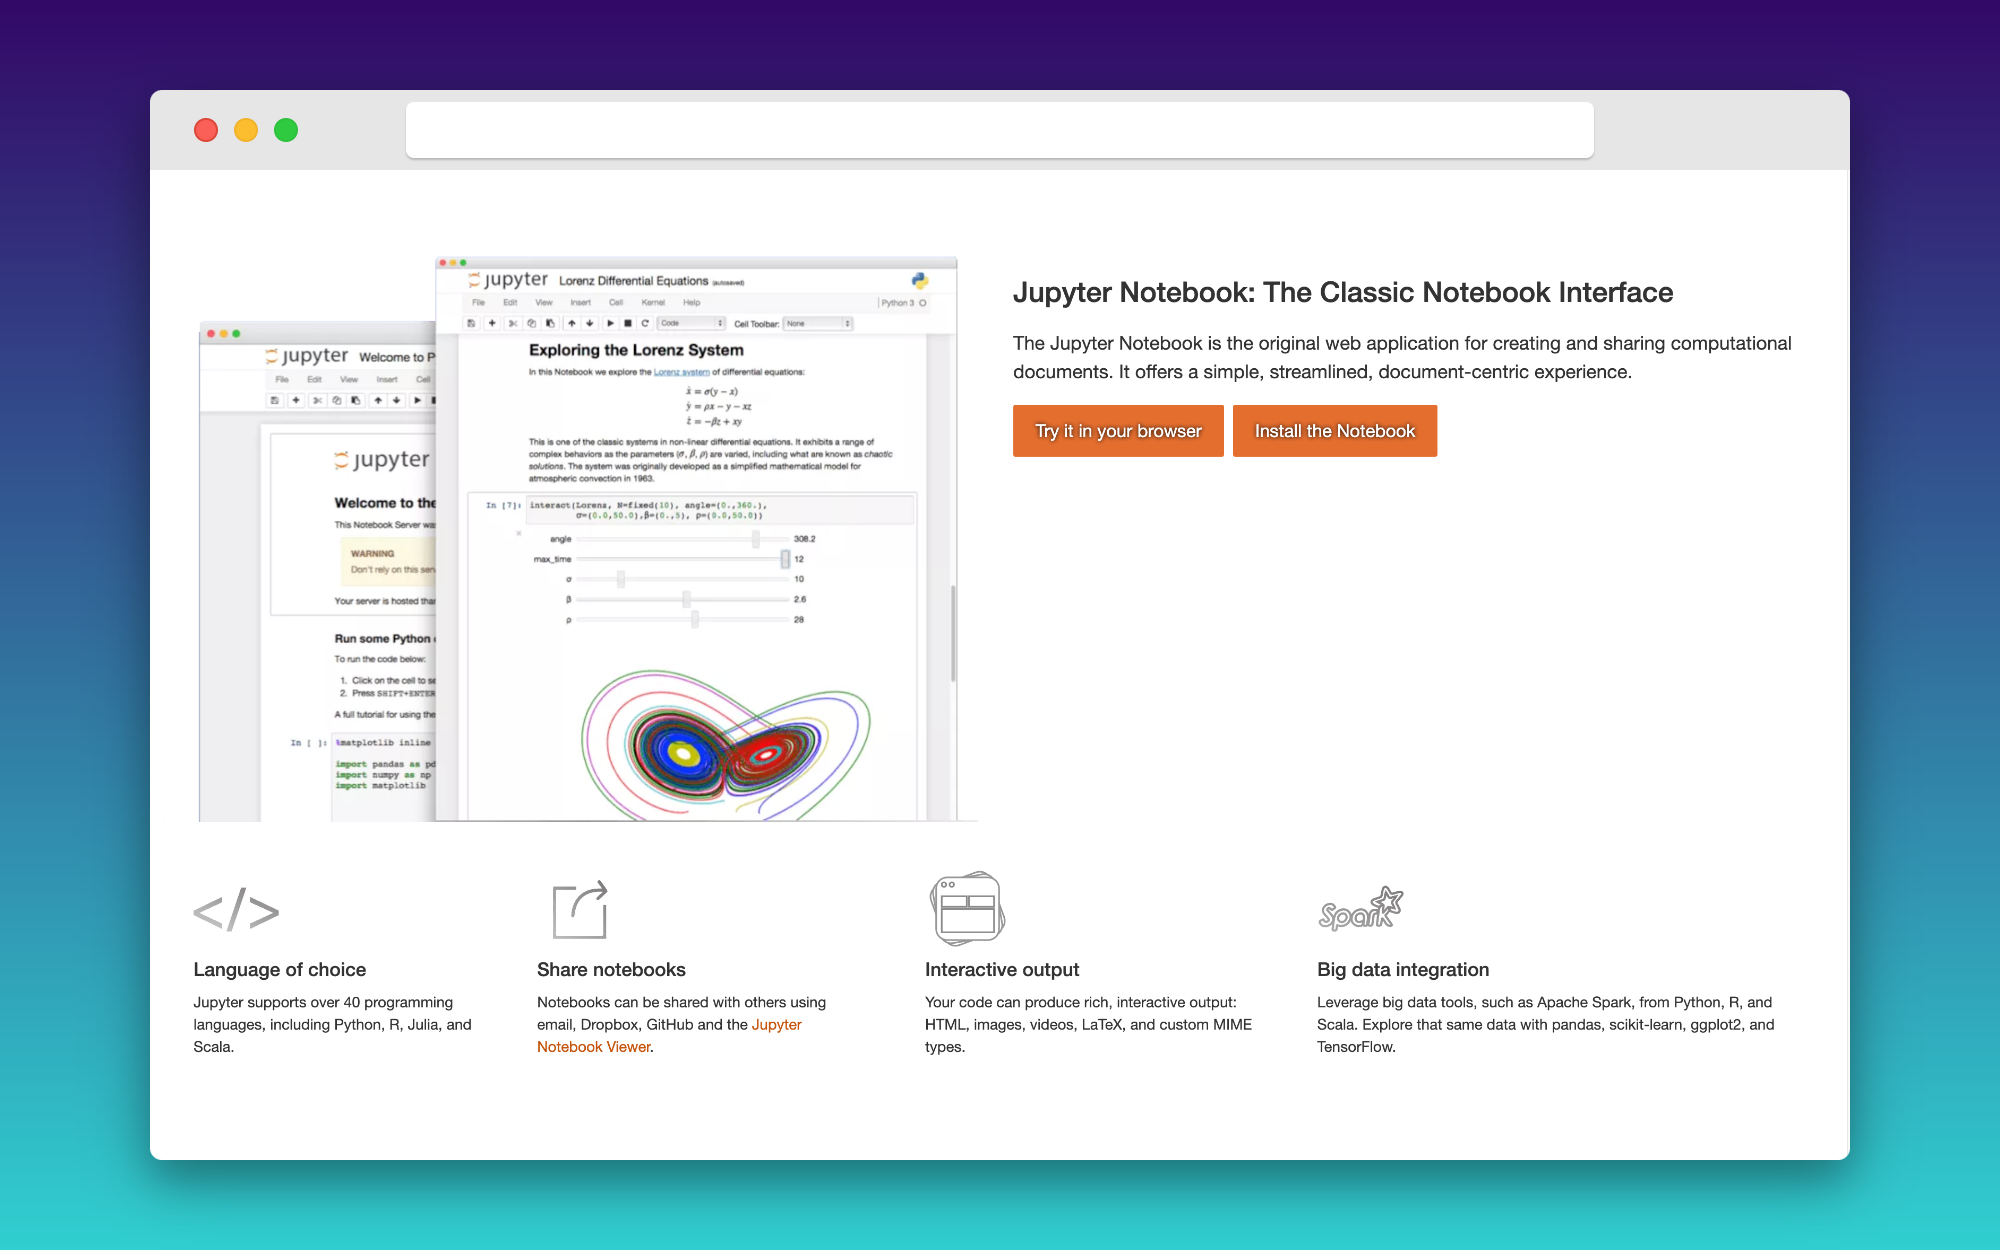
Jupyter Notebook
Jupyter Notebook (opens in a new tab) is an open-source web-based interactive computing platform that allows users to create and share documents that contain live code, equations, visualizations, and narrative text. It is widely used in data science, machine learning and scientific computing.
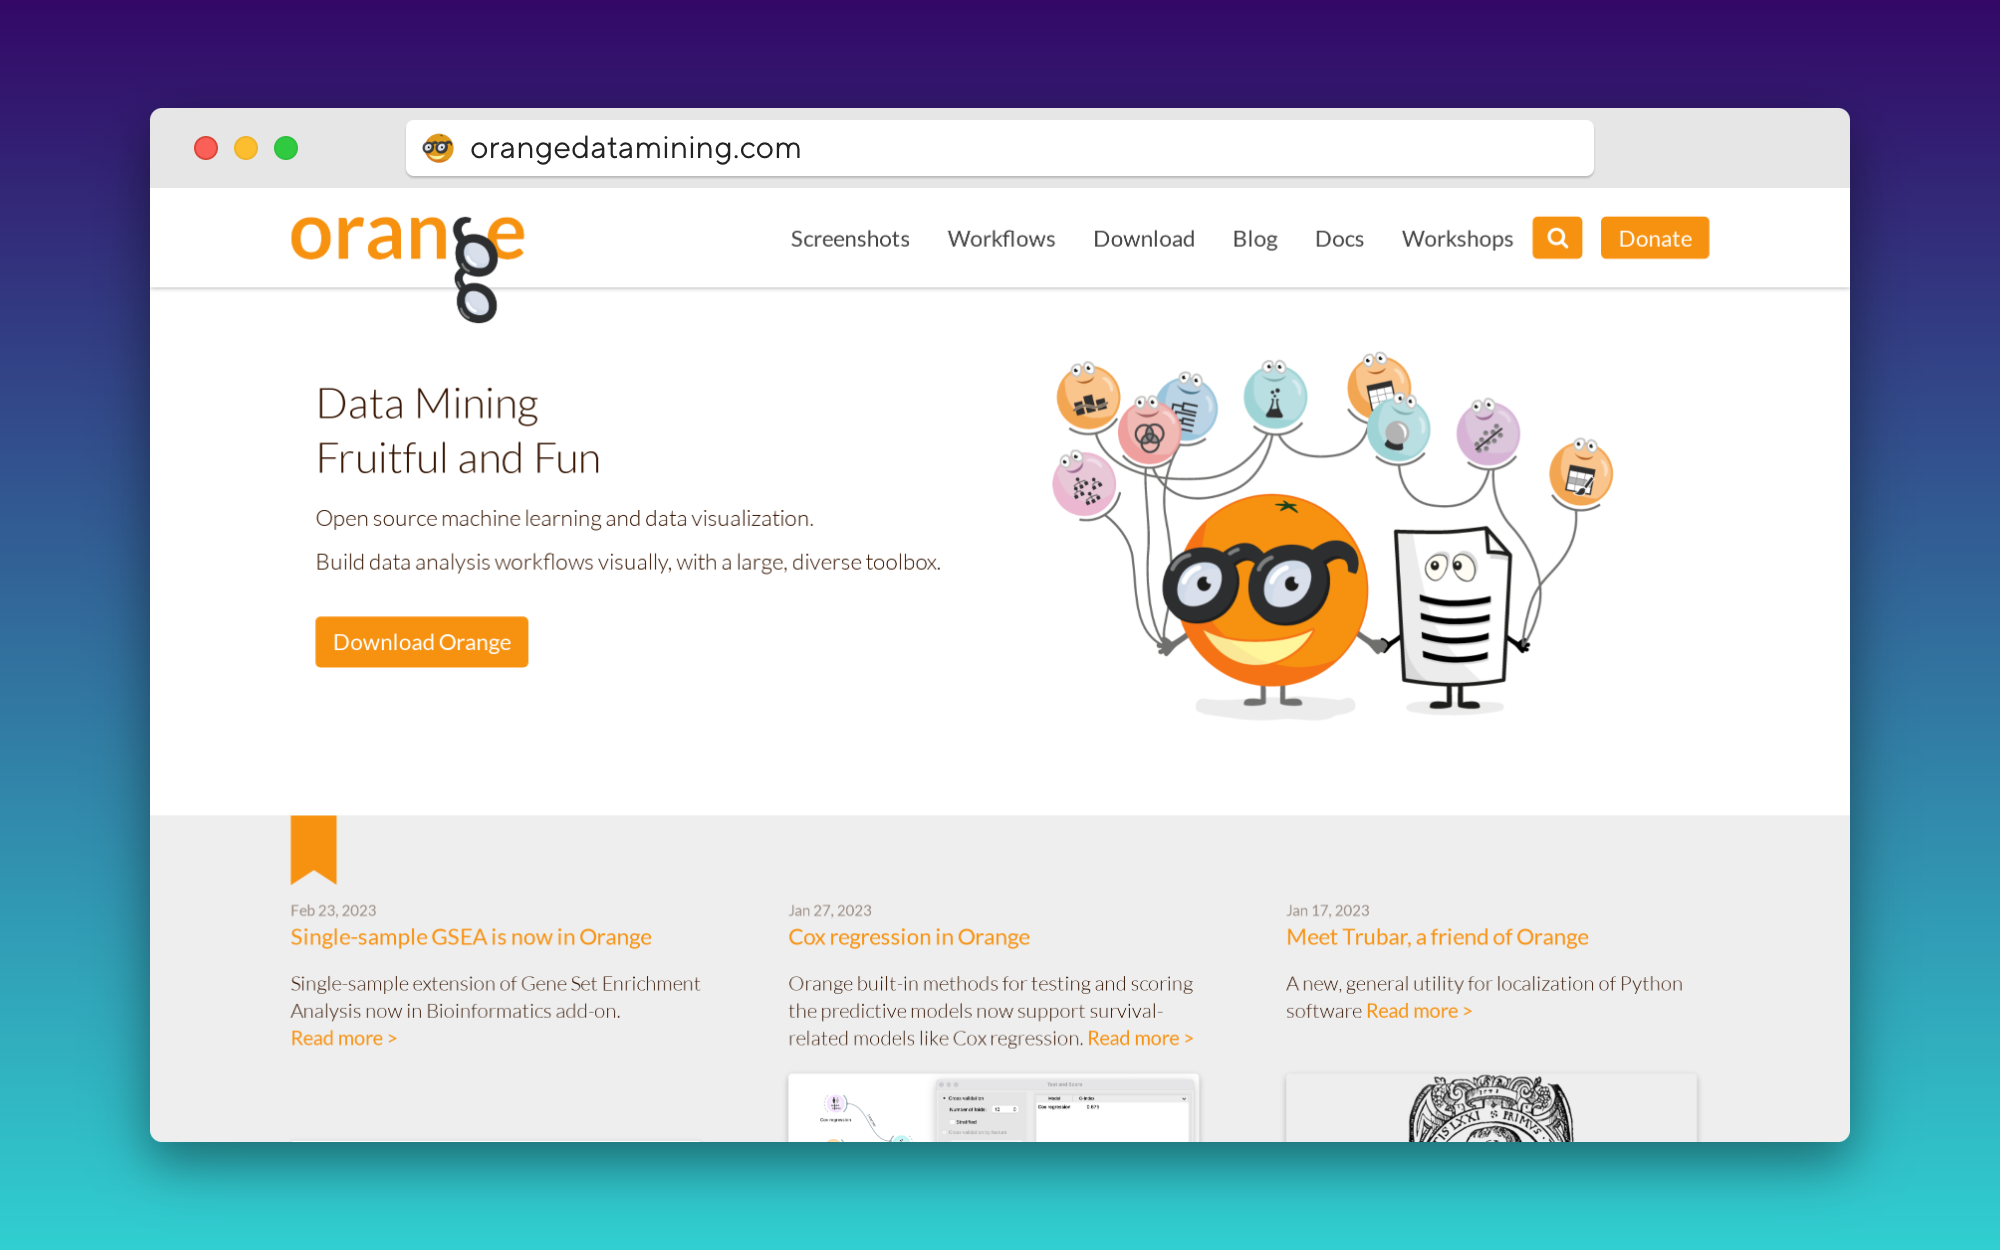
Orange
Orange (opens in a new tab) is an open-source data visualization and data mining software package. It includes a range of data visualization widgets, and a data mining framework that includes preprocessing, feature selection, and modeling.
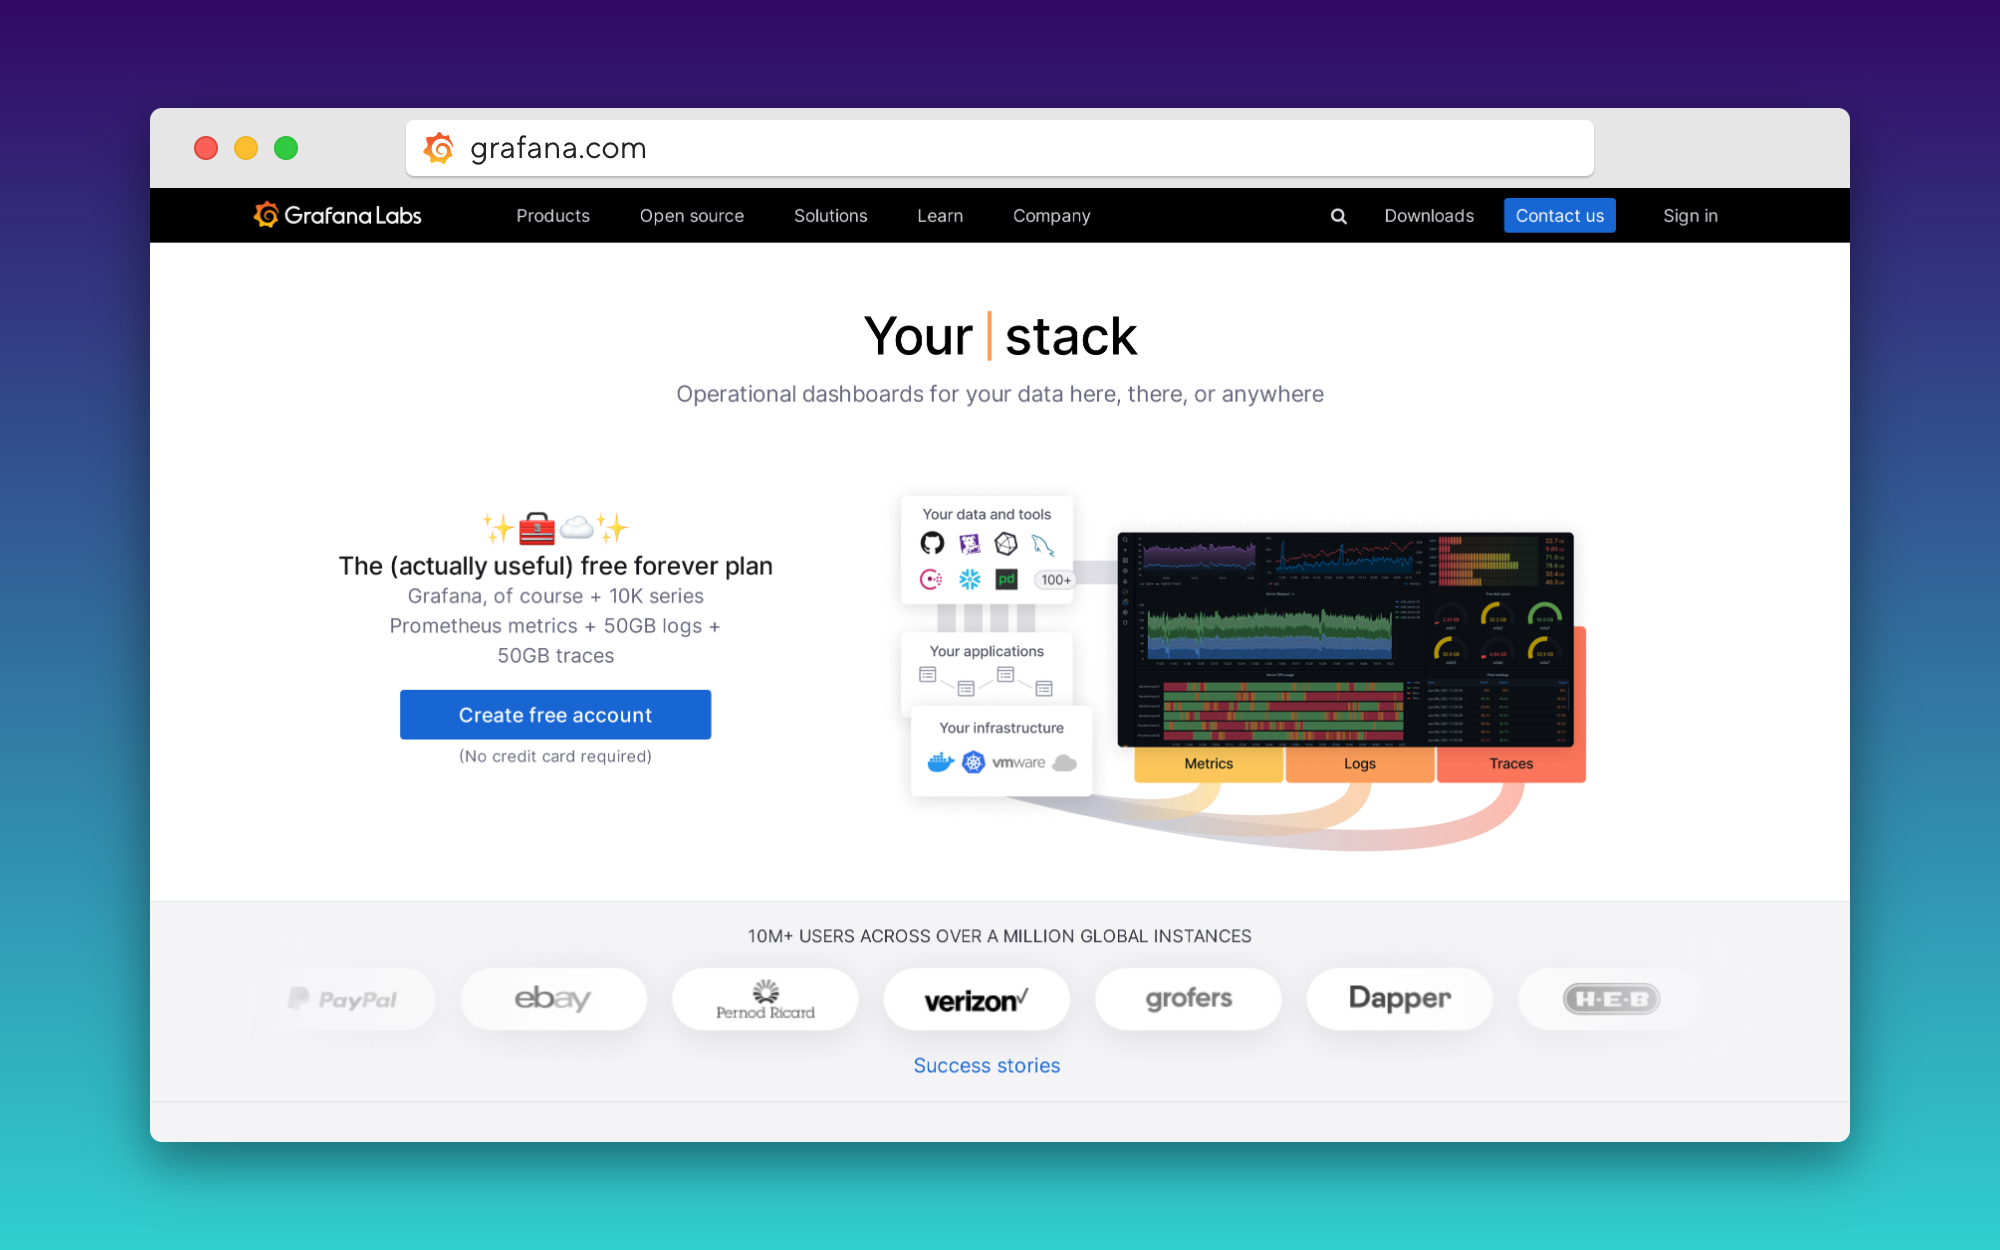
Grafana
Grafana (opens in a new tab) is an open-source data visualization and monitoring platform. It allows users to create and share interactive dashboards and visualizations that can be used to monitor and analyze data from various sources. It can be used to monitor metrics, traces, and logs from different systems and applications, making it a powerful tool for monitoring and troubleshooting in data-driven organizations.
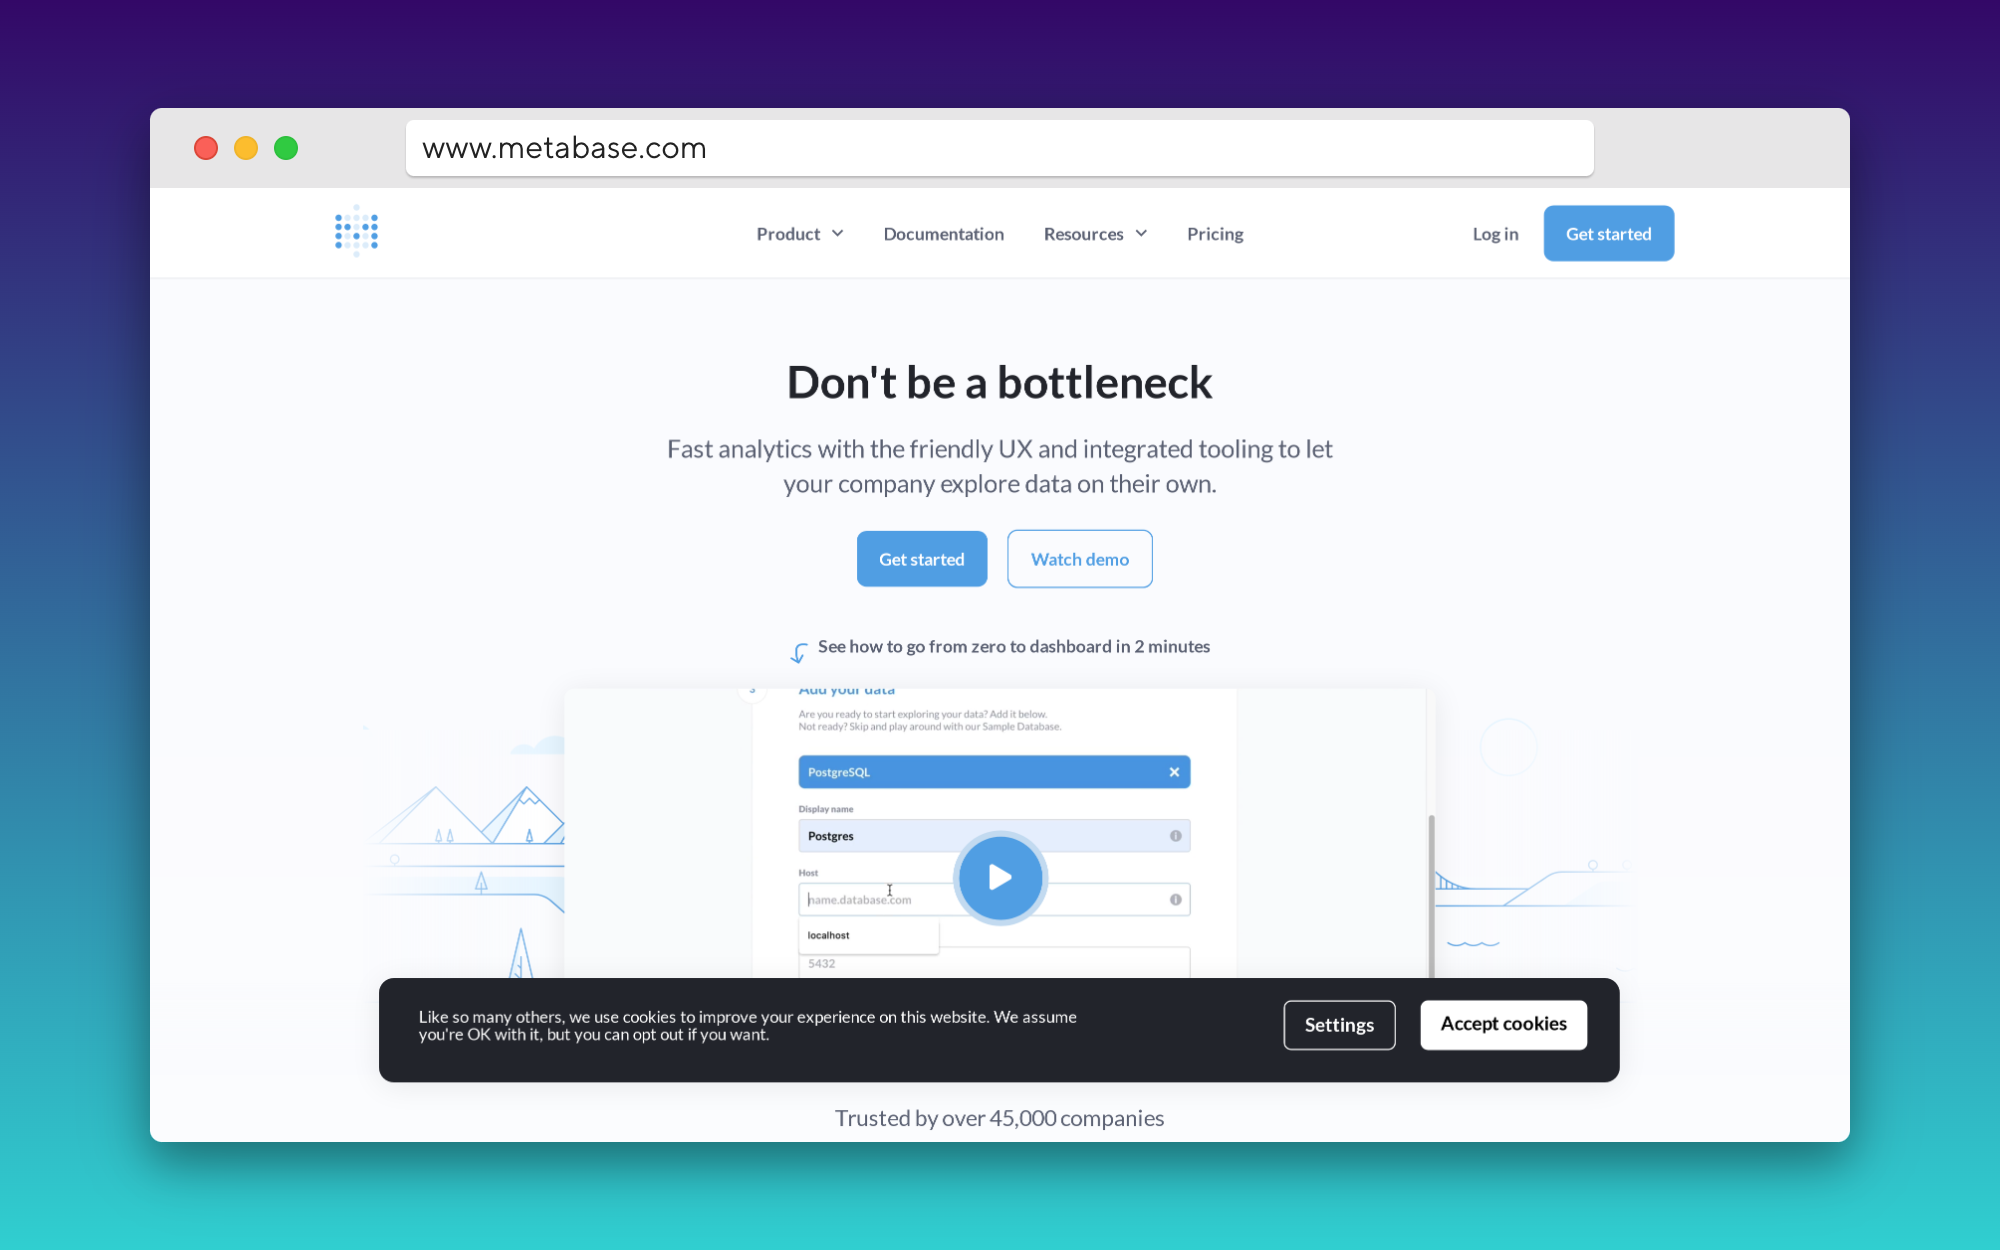
Metabase
Metabase (opens in a new tab) is an open-source data visualization and business intelligence tool. It allows users to easily create and share interactive dashboards, charts and reports. It supports a wide range of data sources and provides a simple user interface that allows non-technical users to easily explore data and gain insights. It also offers a SQL interface, making it easy to perform complex data analysis tasks.
FAQ
What are the benefits of using open-source tools for data analysis and visualization?
Open-source tools for data analysis and visualization offer a cost-effective and flexible alternative to proprietary tools. They often have large and active communities that provide support and contribute to the development of the software. Additionally, open-source tools provide access to the source code, allowing users to customize and modify the software to fit their specific needs.
Can I use RATH for real-time data analysis?
RATH is designed to automate the data exploration process and provide powerful data visualization, it's not designed for real-time data analysis. However, tools like Apache Kafka and Apache Spark that were listed in the article can handle high volumes of data with low latency and are particularly well-suited for use cases such as real-time data analysis and data integration.
How do I choose the right open-source tool for my data analysis and visualization needs?
When choosing an open-source tool for data analysis and visualization, it's important to evaluate your specific use case and determine which tool best meets your needs. Consider factors such as the type of data you'll be working with, the complexity of your analysis, and the level of customization required. Additionally, it's important to consider the size and activity of the community surrounding the tool, as a large and active community can provide support and resources for learning and troubleshooting.
Conclusion
In conclusion, open-source software has become an essential tool for data analysis and visualization. The options discussed above are just a few of the many available, each with its own strengths and weaknesses. As a data analyst, it is important to evaluate your specific use case and choose the tool that best meets your needs. RATH is a great open source alternative for data analysts who are looking for an automated and powerful data exploration tool. It automates the data exploration process and provides powerful data visualization, making it an essential tool for any data-driven organization.