Matplotlib's Common Hurdle: 'matplotlib is currently using agg'
Published on
'matplotlib is currently using agg' is an issue that many Python enthusiasts face while working with Matplotlib for data visualization. This error message suggests that Matplotlib is utilizing a non-graphical user interface (GUI) backend, hindering the display of figures or plots. It's time to dig deep into this issue and uncover the ways to navigate around it.
Understanding GUI and Non-GUI backends
To tackle the issue, it's important first to understand the concept of GUI and non-GUI backends.
GUI Backend: The Visualization Powerhouse
GUI, short for graphical user interface, is the interactive medium between the user and computing devices. It leverages visual elements like windows, icons, and menus, thereby enabling users to interact seamlessly with their devices. In Python, Tkinter is the most frequently employed method for GUI development.
Non-GUI Backend: The Text-based Interaction Mode
Conversely, a non-GUI backend is a machine-based interaction mode that operates sans graphics, relying solely on text-based communication. The warning message 'matplotlib is currently using agg' is an indication that Matplotlib is using a non-GUI backend.
Addressing 'matplotlib is currently using agg' Issue
Given below are solutions to resolve the 'matplotlib is currently using agg' error.
Solution #1: Install Tkinter, a GUI Backend
Installing a GUI-backend like Tkinter can remedy the situation. Here's how to install it across different environments:
Linux
To install the GUI backend in Linux, use the following command:
sudo apt-get install python3-tkJupyter Notebook
To introduce the GUI backend to a Jupyter notebook, run:
pip install tkPost installation, import the Tkinter library using the following syntax:
from tkinter import *Anaconda Distribution
For Anaconda users, the Tkinter installation command is:
conda install tkOnce installed, the Tkinter library can be imported with:
import tkinterSolution #2: Install PyQt5, Another GUI Backend
An alternative GUI backend to consider is PyQt5, a Python binding for the Qt libraries, often used in GUI application development. Here's how to install PyQt5:
Jupyter Notebook
Use the following command to install PyQt5 in Jupyter Notebook:
pip install pyqt5Linux
For Ubuntu Linux or Debian Linux users, the PyQt5 installation command is:
sudo apt-get install python3-pyqt5CentOS 7
CentOS 7 users can install PyQt5 by running:
yum install qt5-qtbase-develRedhat based System
RPM-based system users, including Redhat, can use:
yum install PyQt5Anaconda Distribution
For those using the Anaconda Prompt, the command is:
conda install pyqtAlternative to Matplotlib: Visualize Data with PyGWalker
Besides using Matplotlib to visualize your pandas dataframe, here is an alternative, Open Source python library that can help you create data visualization with ease: PyGWalker (opens in a new tab).
No need to complete complicated processing with Python coding anymore, simply import your data, and drag and drop variables to create all kinds of data visualizations! Here's a quick demo video on the operation:
Here's how to use PyGWalker in your Jupyter Notebook:
pip install pygwalker
import pygwalker as pyg
gwalker = pyg.walk(df)
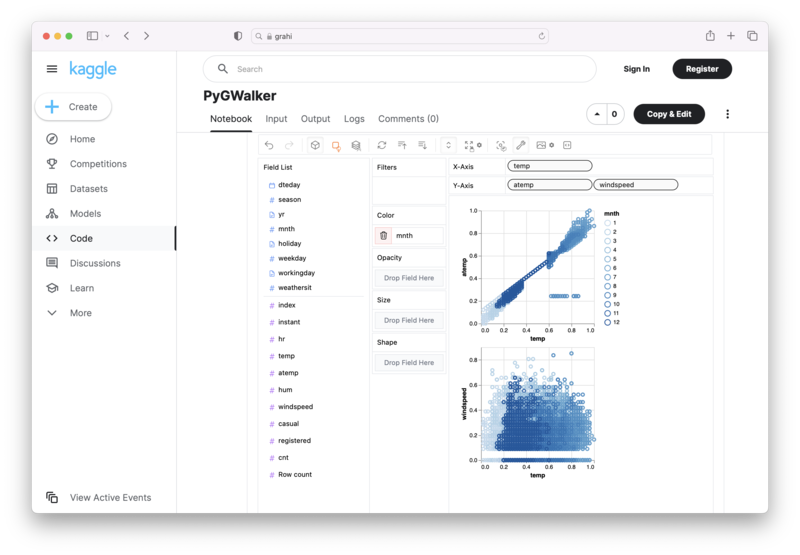
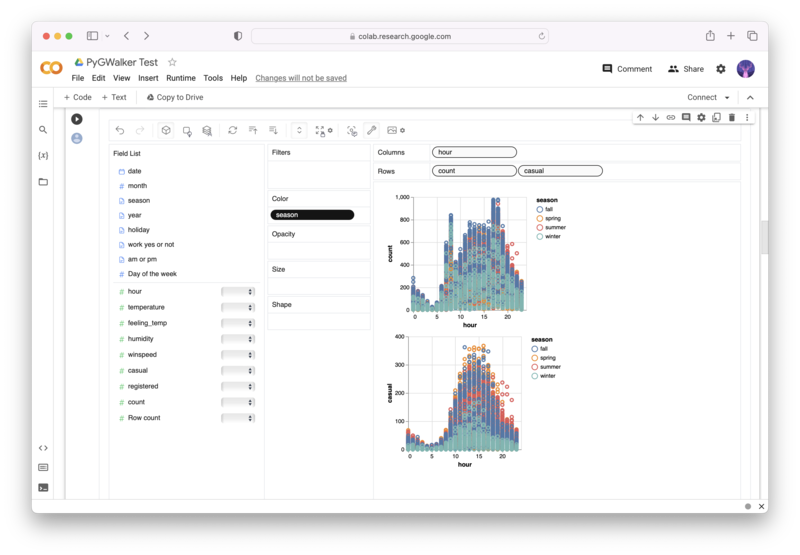
Alternatively, you can try it out in Kaggle Notebook/Google Colab:
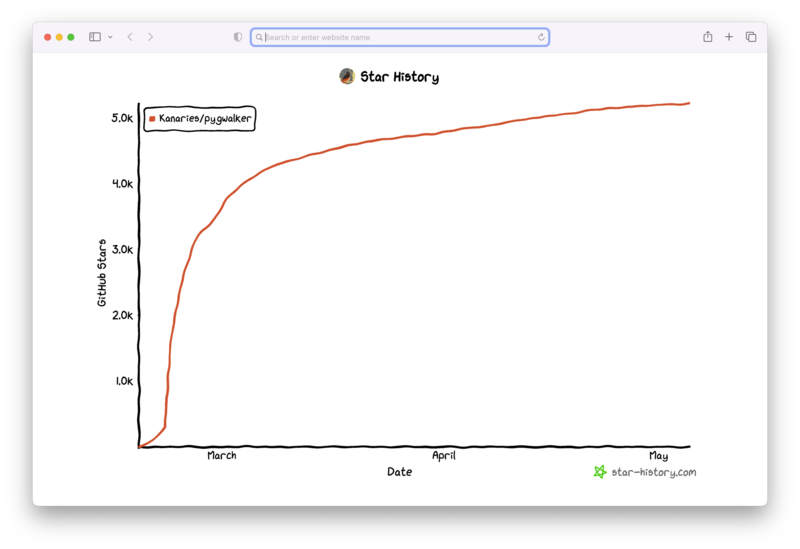
PyGWalker is built on the support of our Open Source community. Don't forget to check out PyGWalker GitHub (opens in a new tab) and give us a star!
Closing Thoughts
Though 'matplotlib is currently using agg' can initially seem intimidating, it's a hurdle that can be smoothly navigated with proper understanding and the right commands. By equipping Matplotlib with a robust GUI backend like Tkinter or PyQt5, the data visualization process can continue unabated, fueling Python's capabilities for insightful and interactive plotting.


