How to Easily Handle Fill_between in Matplotlib
Published on
Data visualization is as much an art as it is a science. One of the most powerful tools in a data scientist's arsenal is Matplotlib, a versatile Python library that provides a solid foundation for creating a wide variety of charts, plots, and more complex data visualizations. Among its vast array of features, one stands out for its unique ability to highlight areas of significance within a graph – the fill_between function.
The fill_between function can be used to fill the area between two lines, but its capabilities go beyond simple fills. With a little bit of ingenuity, it can be utilized to create conditional fills that can highlight specific periods or patterns in your data. This article aims to offer a rich, detailed explanation on how to harness the power of fill_between, enhancing your Matplotlib plots and outshining the best resources available.
Why fill_between Matters in Matplotlib
The ability to fill areas between lines in a plot provides a visual emphasis that can accentuate differences, trends, or patterns within your data. It can be instrumental in pointing out key areas, guiding the viewer's attention to significant data points, or simply adding an aesthetic touch to your graphs. When combined with conditional statements, it can take on a new level of utility, allowing for more nuanced and specific highlights in your data.
Filling Between Lines: The Basics
Before diving into conditional filling, let's understand how fill_between works at a basic level. The function takes at least three arguments:
- The x-values: These set the horizontal boundaries of the fill.
- The first y-values: These set the lower vertical boundary.
- The second y-values: These set the upper vertical boundary.
Here's a simple example:
import matplotlib.pyplot as plt
import numpy as np

x = np.linspace(0, 10, 100)
y1 = np.sin(x)
y2 = np.cos(x)

plt.plot(x, y1, '-b', label='sine')
plt.plot(x, y2, '-r', label='cosine')
plt.fill_between(x, y1, y2, color='gray', alpha=0.5)
plt.show()
In this example, the area between the sine and cosine functions is filled with a gray color.
Introducing Conditional Fills with where
The fill_between function can also accept a where argument. This argument allows you to specify a boolean condition, under which the fill will be applied. In other words, the fill will only happen where this condition is True.
Now, let's use a simple DataFrame example to illustrate this. Suppose we have a DataFrame df with columns A and B, and we want to fill between these two lines:
plt.fill_between(df.index, df['A'], df['B'], where=(df['A'] > df['B']), color='gray', alpha=0.5)This fills the area between A and B only where A is greater than B.
The Issue: Conditional Fill Between Specific Index Values
When trying to use fill_between with a condition involving specific index values, you might encounter a common error. It's well-illustrated by a question posted by a user who wanted to fill the area between two lines, but only for specific months: 'January', 'February', and 'March'. Their initial attempts resulted in either a ValueError or no fill at all.
Let's delve into this issue, understand the root cause, and provide a foolproof solution, right after the break.
Understanding the Root Cause of the Error
Continuing from where we left off, the user attempted to fill between two lines of a DataFrame, with a condition on the index values. Specifically, they wanted to apply the fill only to the months of 'January', 'February', and 'March'. However, they encountered an issue.
The ValueError they received when trying to use the in keyword with an array and a list is because Python's in keyword checks for an element in an iterable. But in this case, it was being used to check if an array, which is not an iterable, is in a list. This operation is ambiguous and thus, it throws an error.
The reason why their second attempt (where they converted the index to a list and used the in keyword) yielded no fill is because the in operation was still not being vectorized, i.e., applied element-wise.
The Solution: Vectorizing the Condition with isin()
A key concept in pandas, vectorization involves performing operations on entire arrays rather than individual elements. To fill between lines conditionally based on specific index values, we need to vectorize the condition by using pandas' built-in method .isin(). This method checks each element of the DataFrame's index against a list and returns a boolean Series.
The correct solution for the user's issue would therefore be:
ax.fill_between(x = plotMonths.index,
                y1 = plotMonths['ro laws'],
                y2 = plotMonths['ro ordos'],
                where = plotMonths.index.isin(['January', "February", 'March']),
                facecolor = 'lightskyblue',
                alpha = 0.2)
Here, where = plotMonths.index.isin(['January', "February", 'March']) checks each element of plotMonths.index against the list ['January', "February", 'March'] and returns a boolean Series. This Series is used to conditionally fill between the lines 'ro laws' and 'ro ordos'.
Alternative to Matplotlib: Visualize Data with PyGWalker
Besides using Matplotlib to visualize your pandas dataframe, here is an alternative, Open Source python library that can help you create data visualization with ease: PyGWalker (opens in a new tab).
No need to complete complicated processing with Python coding anymore, simply import your data, and drag and drop variables to create all kinds of data visualizations! Here's a quick demo video on the operation:
Here's how to use PyGWalker in your Jupyter Notebook:
pip install pygwalker
import pygwalker as pyg
gwalker = pyg.walk(df)
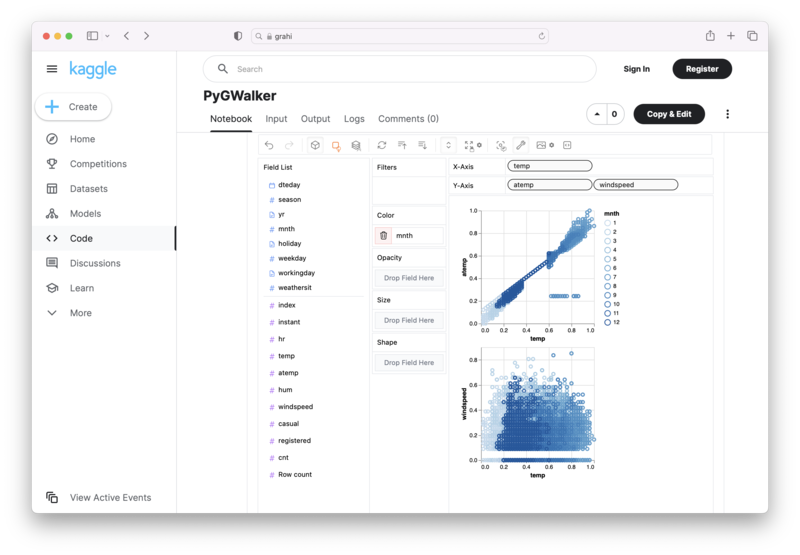
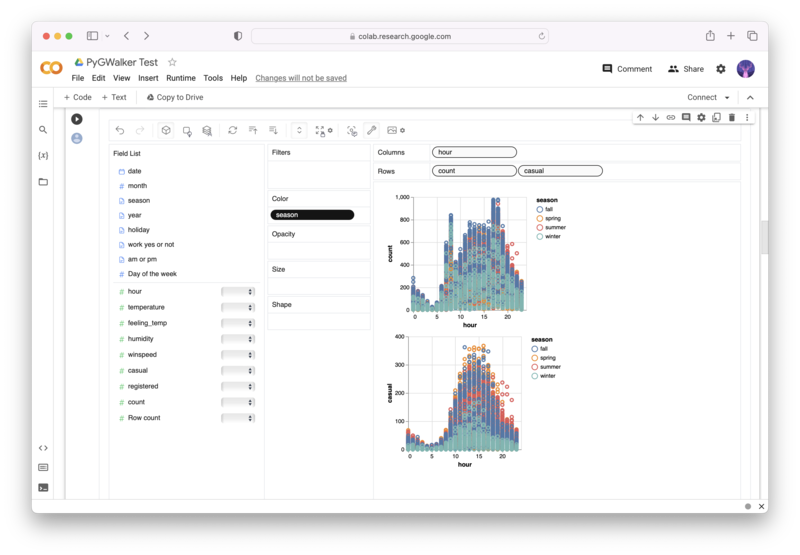
Alternatively, you can try it out in Kaggle Notebook/Google Colab:
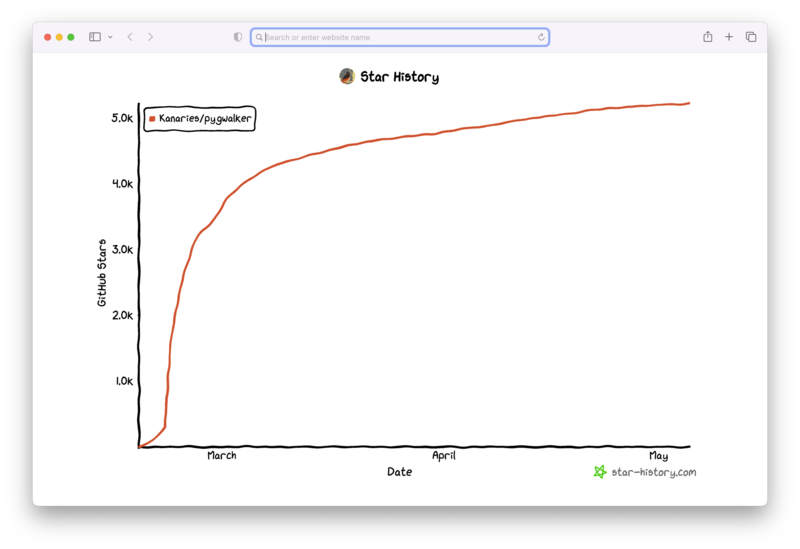
PyGWalker is built on the support of our Open Source community. Don't forget to check out PyGWalker GitHub (opens in a new tab) and give us a star!
Conclusion
The fill_between function in Matplotlib offers powerful features for adding visual emphasis to your plots. It allows for filling between lines, and with the use of the where argument, it can perform conditional fills. Understanding these features and their underlying principles is essential for effective data visualization.
Frequently Asked Questions
Throughout this article, we've delved into the fill_between function, its uses, and its implementation. Here are a few frequently asked questions to summarize and reinforce key points:
Q1: What is the fill_between function in Matplotlib?
The fill_between function is used to fill the area between two lines in a plot. It's a powerful tool for highlighting differences, trends, or patterns in the data.
Q2: How can I fill between lines conditionally in Matplotlib?
You can use the where argument in the fill_between function to fill between lines based on a condition. This condition should be a boolean Series with the same index as your x-values.
Q3: Why do I get a ValueError when using fill_between with a condition on specific index values?
This error occurs when Python's in keyword is used to check if an array is in a list. To solve this, you can use the pandas .isin() method, which checks each element of the DataFrame's index against a list and returns a boolean Series.


