Is There AI that Can Make Charts and Graphs?
- Name
- Kana Mikami
Published on
Data visualization is a critical aspect of data analysis and business intelligence. It allows us to understand complex data sets by representing them in a visual, easy-to-understand format. With the advent of artificial intelligence (AI), data visualization has taken a giant leap forward. AI can now generate charts and graphs, providing a more efficient and accurate way to visualize data. This article will explore the world of AI-generated charts and graphs, discussing their benefits, limitations, and how to use them effectively.
Can AI Make Charts and Graphs?
Yes, AI can indeed create charts and graphs. AI-powered tools like Appy Pie's Free AI Graph Maker, Chartify.ai, and Graph Maker are designed to generate customized graphs in minutes. These tools use AI algorithms to analyze your data and create visually appealing and informative graphs. They are user-friendly and require no coding knowledge, making them accessible to everyone, regardless of their technical expertise.
Appy Pie's Free AI Graph Maker, for instance, allows you to create a wide variety of graph types, including area charts, line charts, pie charts, and more. It also offers over 100+ graph design templates, customizable graph templates, and the ability to download your graph in various formats like SVG, PNG, JPG, or PDF.
Best AI Chart and Graph Makers
There are several AI chart and graph makers available today, each with its unique features and benefits. One of the best available options is VizGPT (opens in a new tab).
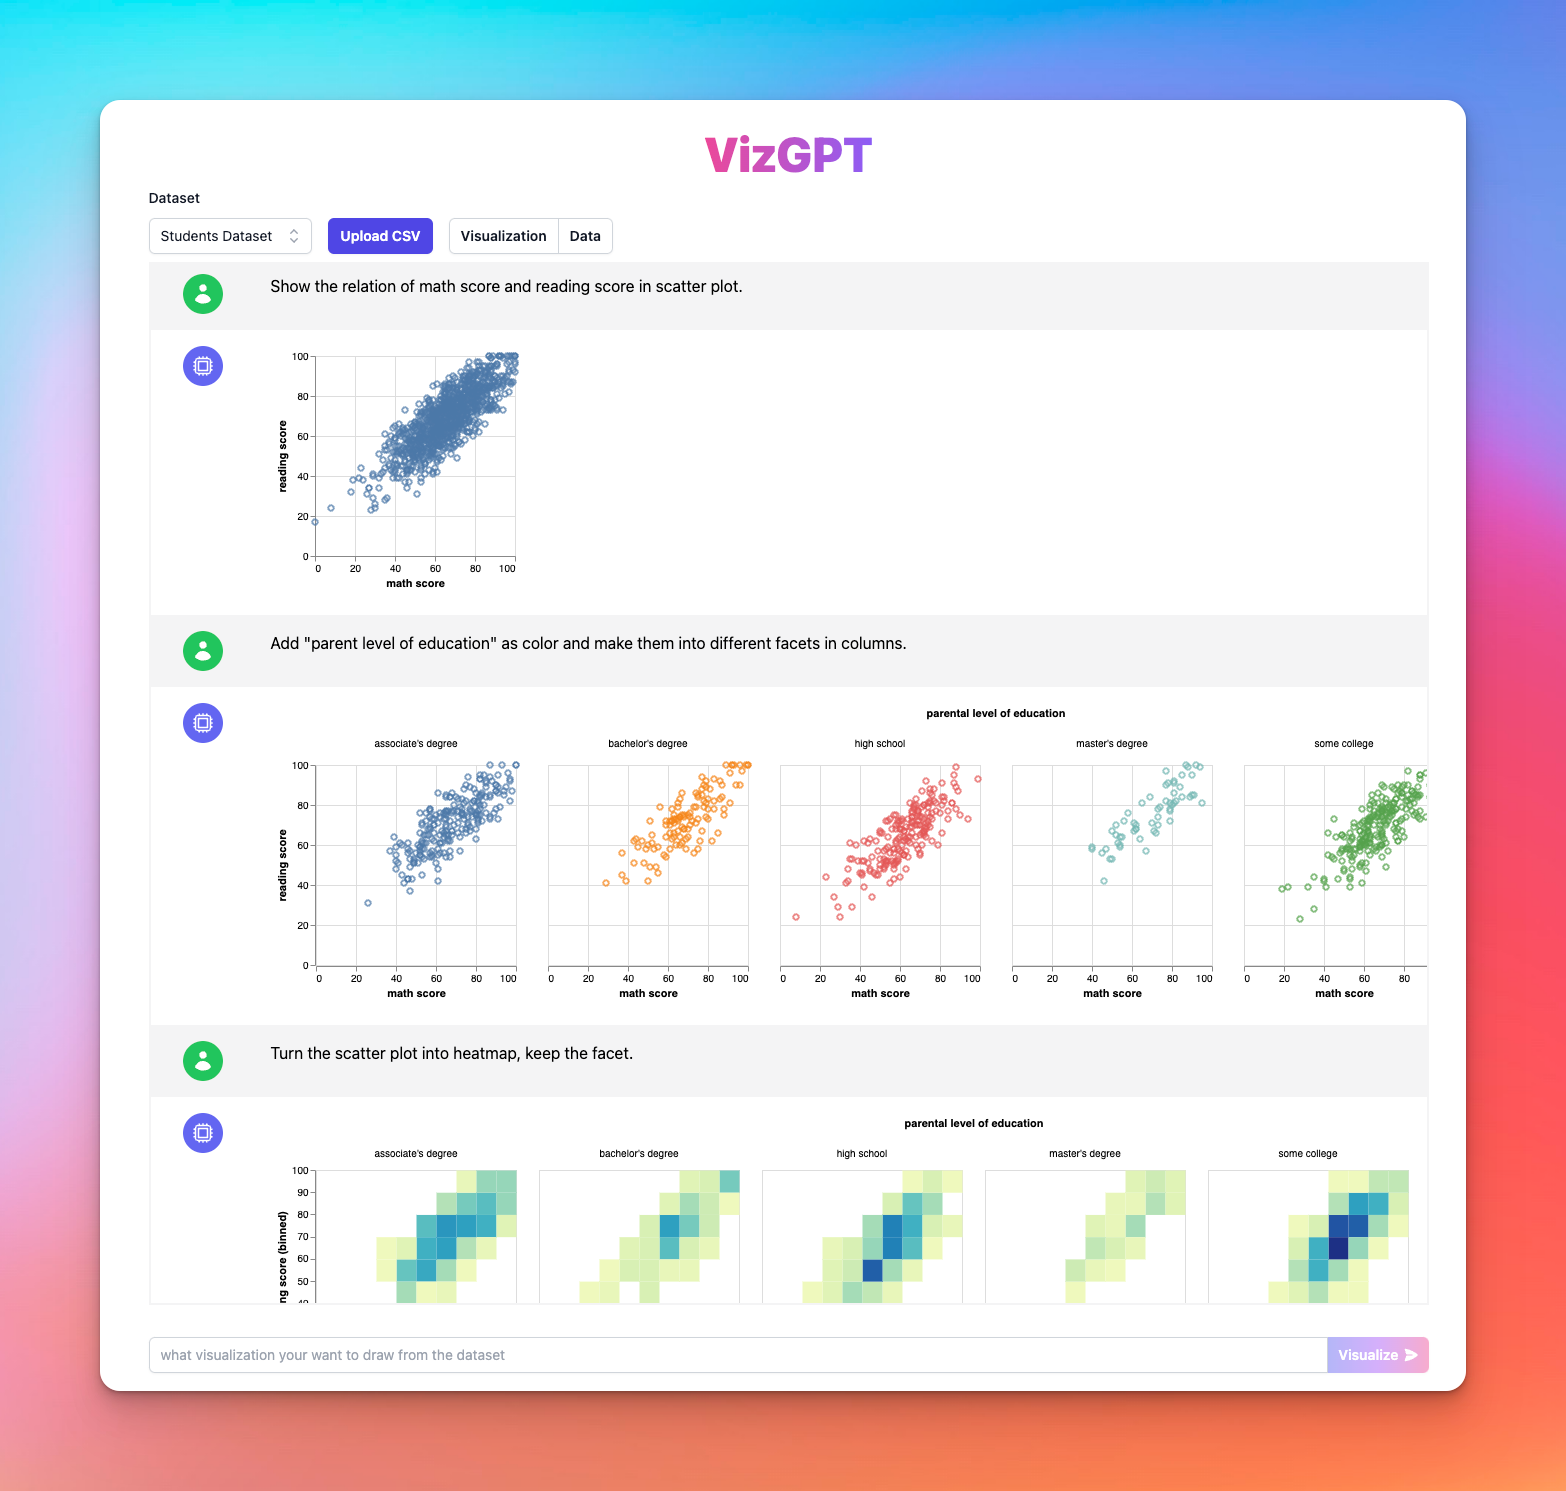
VizGPT provides a chat interface to create and edit data visualizations. Not only can it generate visualizations with a natural language query, but you can also transform or edit your visualization in context.
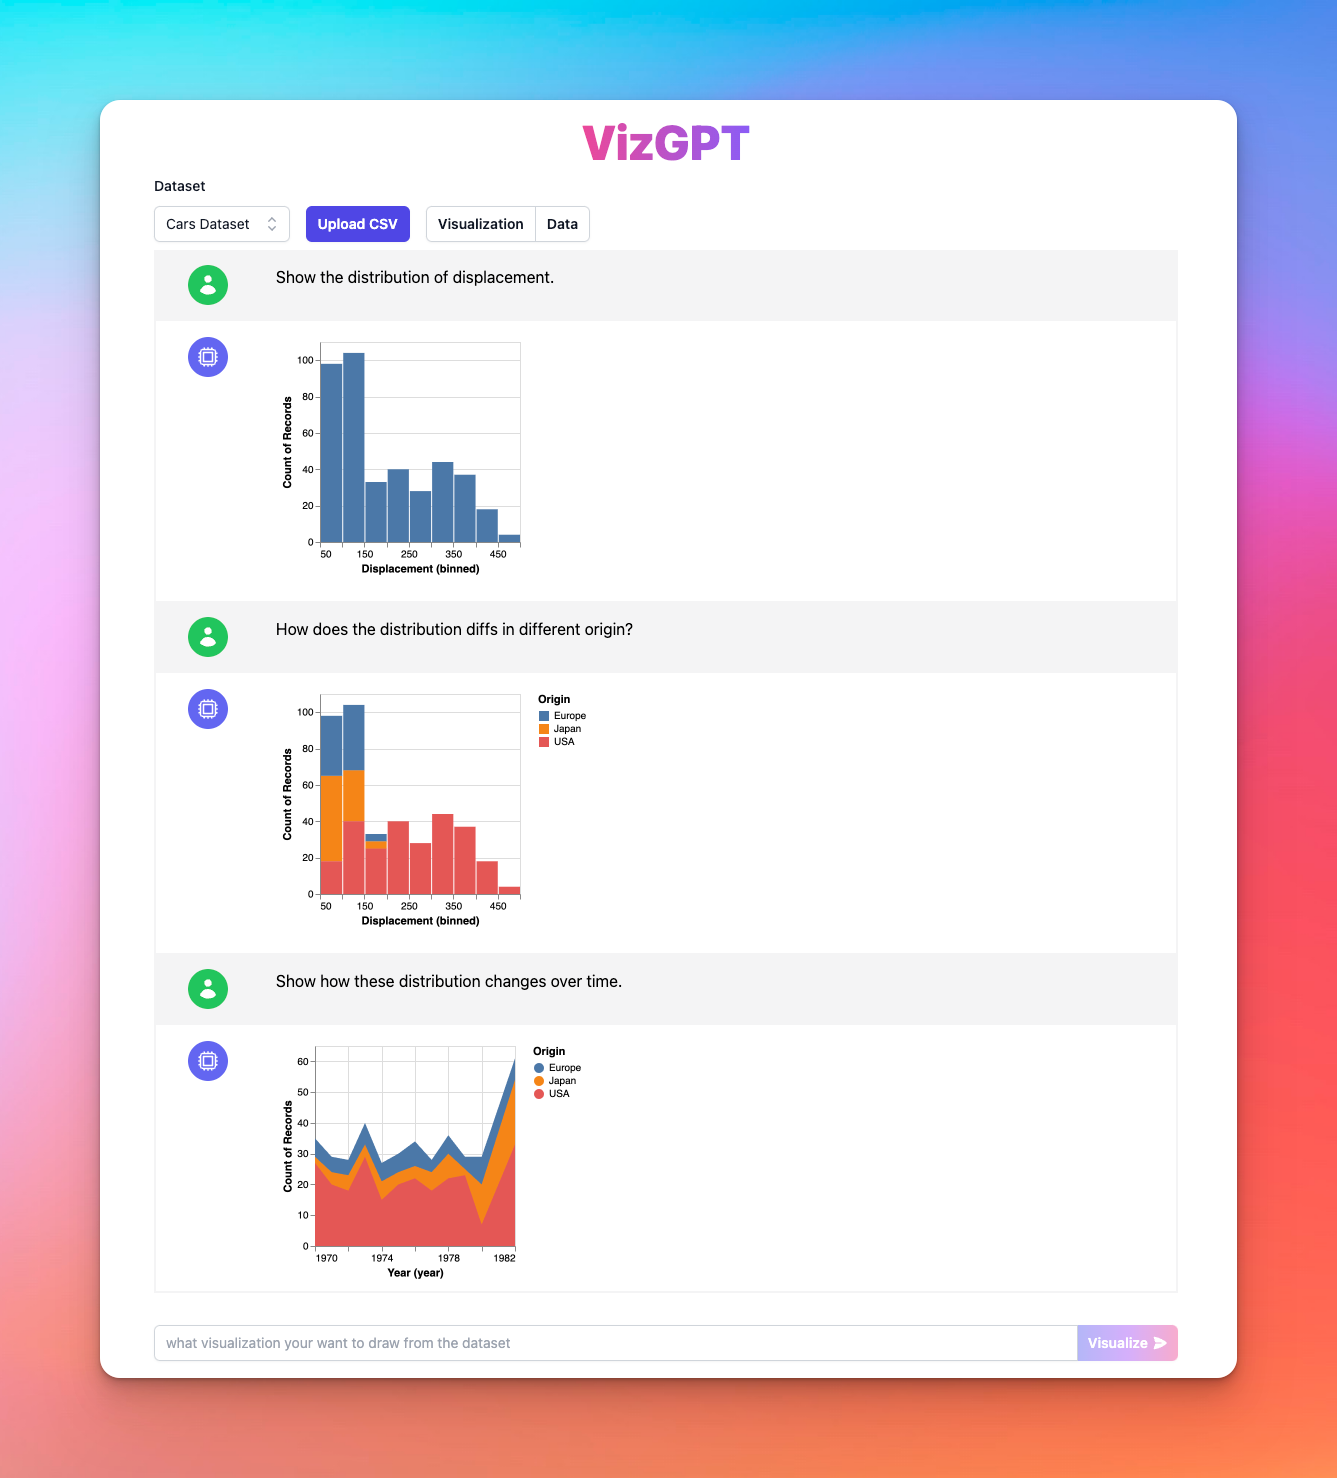
VizGPT allows you to build complex visualizations step by step through chatting, instead of designing a large prompt at once. This makes it ideal for users who are not familiar with data visualization tools or data transformations.
Some of the features VizGPT offers include:
- Natural language to data visualization using Vega-Lite (opens in a new tab)
- Chat context for editing visualizations, allowing users to make changes if the chart doesn't meet their expectations
- Step-by-step exploration of data through chat-based interaction with visualizations
- Uploading your own CSV dataset to create custom visualizations
Feeling good? Try it out at VizGPT Online Playground (opens in a new tab) right now!

Other Notable AI Chart and Graph Makers
-
Appy Pie's Free AI Graph Maker: This tool allows you to create customized graphs within minutes. It offers a simple drag-and-drop interface, over 100+ graph design templates, and the ability to add unlimited data points, titles, labels, and more.
-
Chartify.ai: Chartify is another excellent tool that can create professional-looking charts in minutes. It's perfect for those who need to create charts frequently and quickly.
-
Graph Maker: This tool allows you to create custom bar charts, scatter plots, pie charts, histograms, and line charts. It's a versatile tool that can cater to various data visualization needs.
-
Taskade's AI Knowledge Graph Generator: This tool creates comprehensive and accurate visualizations of data, making it ideal for complex data sets.
-
graphmaker.ai: This tool can generate graphs for any dataset, making it a flexible and versatile choice for data visualization.
-
RATH (opens in a new tab) Next generation of data analysis + generative AI. RATH can understand complex visual patterns in charts and graphs, and generate new charts and graphs based on the patterns it has learned.
How to Use AI to Make Charts and Graphs
Using AI to create charts and graphs is a straightforward process. Here's a simple guide on how to do it using Appy Pie's Free AI Graph Maker:
-
Choose a Template: Start by choosing a template from the platform's vast collection. These templates are designed to suit various data visualization needs.
-
Customize Your Graph: Once you've chosen a template, you can start customizing your graph. Add data points, titles, labels, and more using the tool's simple drag-and-drop interface. You can also change the colors, fonts, and other elements to match your preferences.
-
Download or Embed Your Graph: After creating your graph, you can download it as an image or embed it on your website. The tool supports various formats, including SVG, PNG, JPG, and PDF.
The process may vary slightly depending on the tool you're using, but
but the general idea is the same: choose a template, customize your graph, and download or embed it.
Benefits of Using AI to Make Charts and Graphs
AI-powered chart and graph makers offer several benefits over traditional methods of data visualization:
-
Efficiency: AI tools can generate charts and graphs in a matter of minutes, saving you a significant amount of time.
-
Accuracy: AI algorithms can analyze large data sets with high precision, ensuring that your charts and graphs are accurate and reliable.
-
Customization: AI tools offer a wide range of customization options, allowing you to create charts and graphs that match your specific needs and preferences.
-
Ease of Use: Most AI chart and graph makers are designed to be user-friendly and require no coding knowledge, making them accessible to everyone.
-
Variety: AI tools can create a wide variety of chart and graph types, catering to various data visualization needs.
Limitations of Using AI to Make Charts and Graphs
While AI-powered chart and graph makers offer numerous benefits, they also have some limitations:
-
Data Privacy: When you upload your data to an AI tool, you need to ensure that the platform is secure and respects your data privacy. Not all tools may offer the same level of security, which could potentially expose your data to risks.
-
Complexity: While AI tools are designed to be user-friendly, they can still be complex for beginners. Some users may find it challenging to navigate the tool's features and options.
-
Limited Customization: Although AI tools offer a range of customization options, they may not cater to all specific needs. For instance, some tools may not support certain chart types or customization options.
-
Cost: While some AI chart and graph makers are free, others may require a subscription. The cost can be a limiting factor for small businesses or individuals.
Examples of AI-Generated Charts and Graphs
AI-generated charts and graphs can be used in a variety of fields, from business intelligence to academic research. Here are a few examples:
-
Business Reports: Businesses can use AI to generate charts and graphs for their reports. These visualizations can help stakeholders understand the company's performance and make informed decisions.
-
Academic Research: Researchers can use AI to visualize their data, making it easier to identify trends and patterns.
-
Marketing Campaigns: Marketers can use AI-generated charts and graphs to track the performance of their campaigns and make necessary adjustments.
Best AI Chart and Graph Makers for Beginners and Businesses
For beginners, Appy Pie's Free AI Graph Maker and Graph Maker are excellent choices. They offer user-friendly interfaces and a wide range of customization options, making it easy for beginners to create professional-looking charts and graphs.
For businesses, Chartify.ai and Taskade's AI Knowledge Graph Generator are recommended. These tools offer advanced features that can cater to complex data visualization needs. They also provide options for team collaboration, making them ideal for businesses.
FAQs
- Can AI make charts and graphs?
Yes, AI can make charts and graphs. AI-powered tools like VizGPT can generate customized graphs in minutes.
- What are some of the best AI chart and graph makers?
Some of the best AI chart and graph makers include VizGPT, Chartify.ai, Graph Maker, Taskade's AI Knowledge Graph Generator, and graphmaker.ai.
- What are the benefits of using AI to make charts and graphs?
AI-powered chart and graph makers offer several benefits, including efficiency, accuracy, customization, ease of use, and variety.