Pandas read_csv() Tutorial: Import Data Like a Pro
Published on
If you're looking to import data in your data science project, pandas' read_csv() function is a great place to start. It allows you to read CSV files into memory and offers powerful tools for data analysis and manipulation. In this tutorial, we'll cover everything you need to know to import data like a pro.
Want to quickly create Data Visualizations in Python?
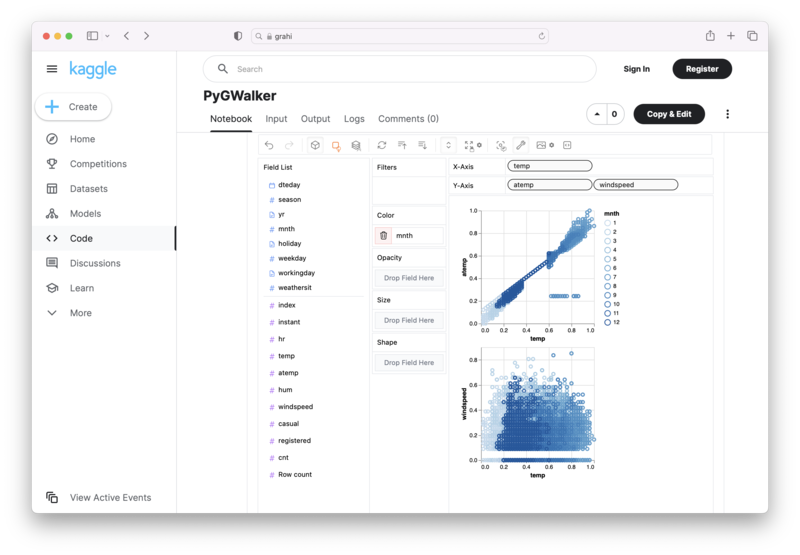
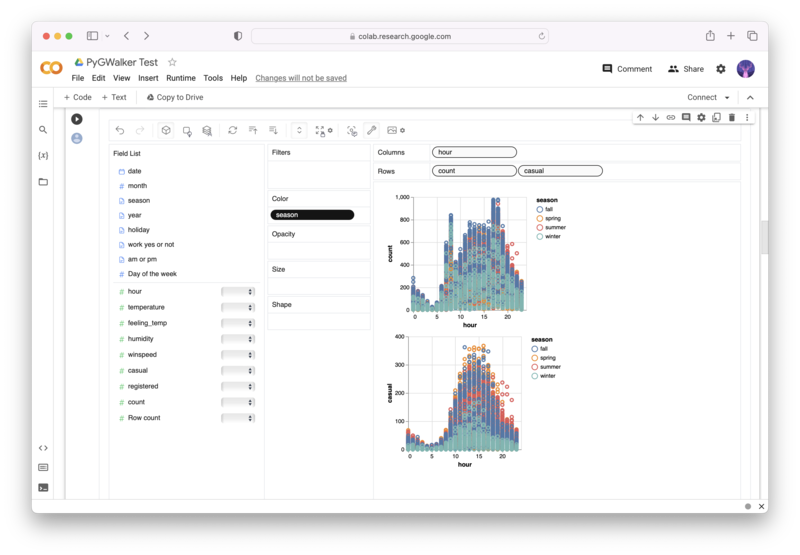
PyGWalker is an Open Source Python Project that can help speed up the data analysis and visualization workflow directly within a Jupyter Notebook-based environments.
PyGWalker (opens in a new tab) turns your Pandas Dataframe (or Polars Dataframe) into a visual UI where you can drag and drop variables to create graphs with ease. Simply use the following code:
pip install pygwalker
import pygwalker as pyg
gwalker = pyg.walk(df)
You can run PyGWalker right now with these online notebooks:
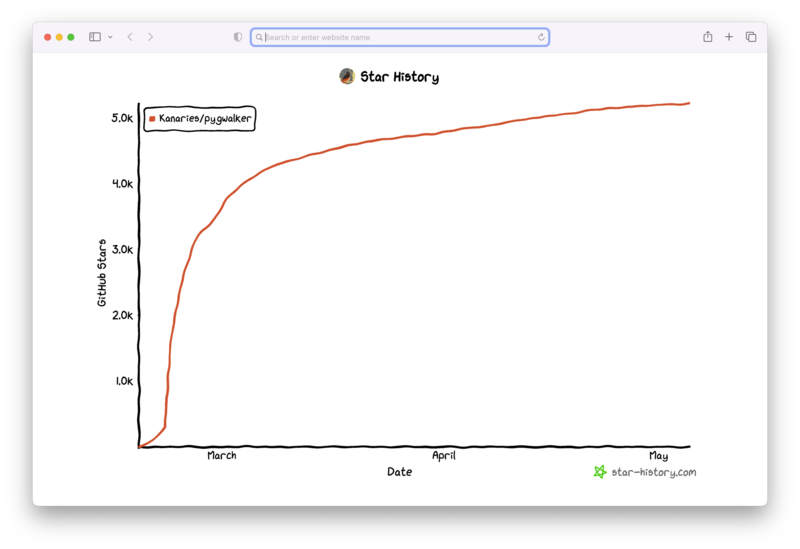
And, don't forget to give us a ⭐️ on GitHub!
What is pandas?
Pandas is a popular open-source library for data manipulation and analysis in Python. It provides data structures and functions necessary to manipulate and analyze structured data, such as spreadsheets, tables, and time series. The main data structures in pandas are the Series and DataFrame, which allow you to represent one-dimensional and two-dimensional data, respectively.
What is the read_csv() function in pandas?
The read_csv() function is a convenient method for reading data from a CSV file and storing it in a pandas DataFrame. This function has numerous parameters that you can customize to suit your data import needs, such as specifying delimiters, handling missing values, and setting the index column.
Benefits of using pandas for data analysis
Pandas provides several benefits for data analysis, including:
- Easy data manipulation: With its powerful data structures, pandas enables efficient data cleaning, reshaping, and transformation.
- Data visualization: Pandas integrates with popular visualization libraries like Matplotlib, Seaborn, and Plotly, making it easy to create insightful plots and graphs.
- Handling large data sets: Pandas can efficiently process large data sets and perform complex operations with ease.
Reading data from a CSV file using pandas
To read a CSV file using pandas, you first need to import the pandas library:
import pandas as pdNext, use the read_csv() function to read your CSV file:
data = pd.read_csv('your_file.csv')This command will read the CSV file and store the data in a pandas DataFrame named data. You can view the first few rows of the DataFrame using the head() method:
print(data.head())How to set a column as the index in pandas
To set a specific column as the index in pandas, use the set_index() method:
data = data.set_index('column_name')Alternatively, you can set the index column while reading the CSV file using the index_col parameter:
data = pd.read_csv('your_file.csv', index_col='column_name')Selecting specific columns to read into memory
If you want to read only specific columns from the CSV file, you can use the usecols parameter of the read_csv() function:
data = pd.read_csv('your_file.csv', usecols=['column1', 'column2'])This command will read only the specified columns and store them in the DataFrame.
Other functionalities of pandas
Pandas offers various other functionalities for data manipulation and analysis, such as:
- Merging, reshaping, joining, and concatenation operations.
- Handling different data formats, including JSON, Excel, and SQL databases.
- Exporting data to various file formats, such as CSV, Excel, and JSON.
- Data cleaning techniques, including handling missing values, renaming columns, and filtering data based on conditions.
- Performing statistical analysis on data, such as calculating mean, median, mode, standard deviation, and correlation.
- Time series analysis, which is useful for handling and analyzing time-stamped data.
How to use pandas for data analysis
To use pandas for data analysis, follow these steps:
- Import the pandas library:
import pandas as pd- Read your data into a DataFrame:
Read your data into a DataFrame:- Explore your data using methods like
head(),tail(),describe(), andinfo():
print(data.head())
print(data.tail())
print(data.describe())
print(data.info())- Clean and preprocess your data, if necessary. This may involve handling missing values, renaming columns, and converting data types:
data = data.dropna()
data = data.rename(columns={'old_name': 'new_name'})
data['column'] = data['column'].astype('int')- Perform data analysis using pandas methods and functions. You can calculate various statistics, filter data based on conditions, and perform operations like grouping and aggregating data:
mean_value = data['column'].mean()
filtered_data = data[data['column'] > 50]
grouped_data = data.groupby('category').sum()- Visualize your data using libraries like Matplotlib, Seaborn, or ggPlot. These libraries integrate seamlessly with pandas, making it easy to create insightful plots and graphs:
import matplotlib.pyplot as plt

data['column'].plot(kind='bar')
plt.show()- Export your processed data to various file formats, such as CSV, Excel, or JSON:
data.to_csv('processed_data.csv', index=False)What are the different data formats that pandas can handle?
Pandas can handle a wide variety of data formats, including:
- CSV: Comma-separated values files.
- JSON: JavaScript Object Notation files.
- Excel: Microsoft Excel files (.xls and .xlsx).
- SQL: Data from relational databases, such as SQLite, MySQL, and PostgreSQL.
- HTML: Data from HTML tables.
- Parquet: Columnar storage format used in the Hadoop ecosystem.
- HDF5: Hierarchical Data Format used for storing large datasets.
How to export data from pandas to a CSV file
To export data from a pandas DataFrame to a CSV file, use the to_csv() method:
data.to_csv('output.csv', index=False)This command will save the DataFrame named data to a CSV file named output.csv. The index=False parameter prevents the index column from being written to the output file.
Common data cleaning techniques in pandas
Some common data cleaning techniques in pandas include:
- Handling missing values: Use methods like
dropna(),fillna(), andinterpolate()to remove, fill, or estimate missing values. - Renaming columns: Use the
rename()method to rename columns in a DataFrame. - Converting data types: Use the
astype()method to convert columns to the appropriate data types. - Filtering data: Use Boolean indexing to filter rows based on specific conditions.
- Removing duplicates: Use the
drop_duplicates()method to remove duplicate rows from a DataFrame. - Replacing values: Use the
replace()method to replace specific values in a DataFrame.
Performing merging, reshaping, joining, and concatenation operations using pandas
Pandas provides several methods for merging, reshaping, joining, and concatenating DataFrames, which are useful for combining and transforming data:
- Merging: The
merge()function allows you to merge two DataFrames based on common columns or indices. You can specify the type of merge to perform, such as inner, outer, left, or right[^9^]:
merged_data = pd.merge(data1, data2, on='common_column', how='inner')- Reshaping: The
pivot()andmelt()functions are useful for reshaping DataFrames. Thepivot()function is used to create a new DataFrame with a hierarchical index, while themelt()function is used to transform wide-format DataFrames to long-format[^10^]:
pivoted_data = data.pivot(index='row', columns='column', values='value') melted_data = pd.melt(data, id_vars='identifier', value_vars=['column1', 'column2'])- Joining: The
join()method is used to join two DataFrames based on their indices. You can specify the type of join, similar to themerge()function:
joined_data = data1.join(data2, how='inner')- Concatenation: The
concat()function is used to concatenate multiple DataFrames along a particular axis (either rows or columns). You can specify whether to concatenate along rows (axis=0) or columns (axis=1)[^11^]:
concatenated_data = pd.concat([data1, data2], axis=0)These operations are fundamental for working with multiple DataFrames and can be combined to create complex data transformations and analyses.
Conclusion
In summary, pandas is a powerful library for data manipulation and analysis in Python. The read_csv() function is an essential tool for importing data from CSV files, and pandas offers a wide range of functions for cleaning, analyzing, and exporting data. By mastering these techniques, you can perform advanced data analysis and create insightful visualizations to drive your data-driven projects.
More Pandas Tutorials:


