Exploring T-Test and P-Value in Python
Published on
Statistical analysis is a powerful tool for understanding and interpreting data. Among the myriad statistical tests available, the T-Test and the concept of P-Value are particularly significant. In this article, we'll dive deep into these concepts, explore their use in Python, and see how they facilitate effective data analysis.
Understanding the T-Test
The T-Test is a statistical hypothesis testing method that allows us to compare the significance between two or more groups. In essence, it helps us determine if there are any notable differences between the groups under scrutiny. It is primarily used with datasets that follow a normal distribution but have unidentified variances.
Acceptance of Hypothesis in T-Test
The T-Test assumes a null hypothesis, stating that the means of two groups are equal. Based on the applied formula, we calculate values and compare them against standard ones, accepting or rejecting the null hypothesis accordingly. If the null hypothesis is rejected, it signifies that the data readings are robust and not a result of mere chance.
Assumptions for Performing T-Test
Before conducting a T-Test, certain assumptions must be fulfilled:
- The data should follow a continuous or ordinal scale
- The data should be a random sample, representing a portion of the total population
- When plotted, the data should result in a normal or bell-shaped distribution
- Variance exists only when the standard deviations of samples are approximately equal
Which T-Test to Use and When
Depending on the data and the problem at hand, we might choose between different types of T-Tests: paired T-Test, two-sample T-Test, and one-sample T-Test.
Introducing P-Value
The P-Value is the probability measure that an observed difference could have occurred by mere chance. The lower the p-value, the greater the statistical significance of the observed difference. P-Values provide an alternative to pre-set confidence levels for hypothesis testing, offering a means to compare results from different tests.
An Example of T-Test and P-Values Using Python
Let's dive into a practical Python example where we apply a T-Test and compute P-Values in an A/B testing scenario. We will generate some data that assigns order amounts from customers in groups A and B, with B being slightly higher.
import numpy as np
from scipy import stats

A = np.random.normal(25.0, 5.0, 10000)
B = np.random.normal(26.0, 5.0, 10000)
stats.ttest_ind(A, B)
The output could look like:
Ttest_indResult(statistic=-14.254472262404287, pvalue=7.056165380302005e-46)Here, the t-statistic is a measure of the difference between the two sets, and the P-value reflects the probability of an observation lying at extreme t-values. If we compare the same set to itself, we will get a t-statistic of 0 and a p-value of 1, supporting the null hypothesis.
stats.ttest_ind(A, A)Result:
Ttest_indResult(statistic=0.0, pvalue=1.0)The threshold
of significance on p-value is subjective and, as everything is a matter of probability, we can never definitively say that an experiment's results are "significant".
The Advantages of Using T-Test
In conclusion, T-Tests offer several advantages:
- They require only limited data for accurate testing
- Their formula is simple and easy to understand
- Their output can be easily interpreted
- They are cost-effective as they eliminate the need for expensive stress or quality testing
By leveraging Python for our statistical analysis, we can effectively use T-Tests and P-Values to better understand and interpret our data, thereby making more informed decisions.
Want to quickly create Data Visualizations in Python?
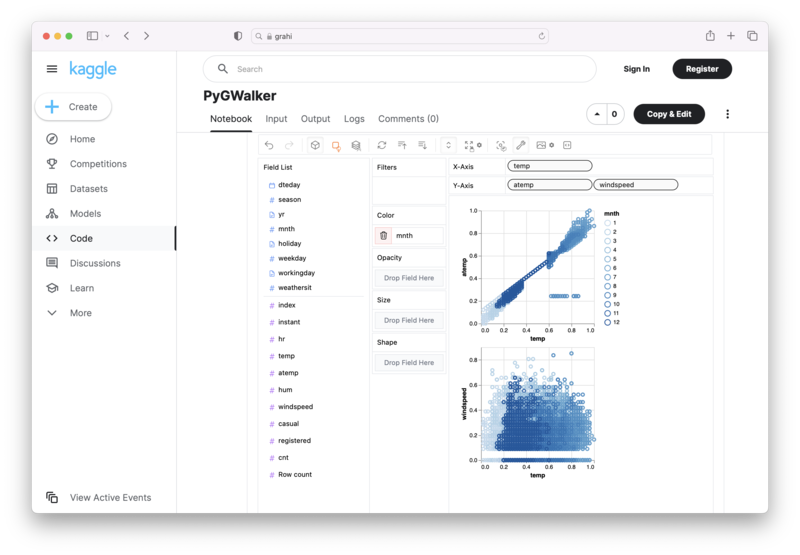
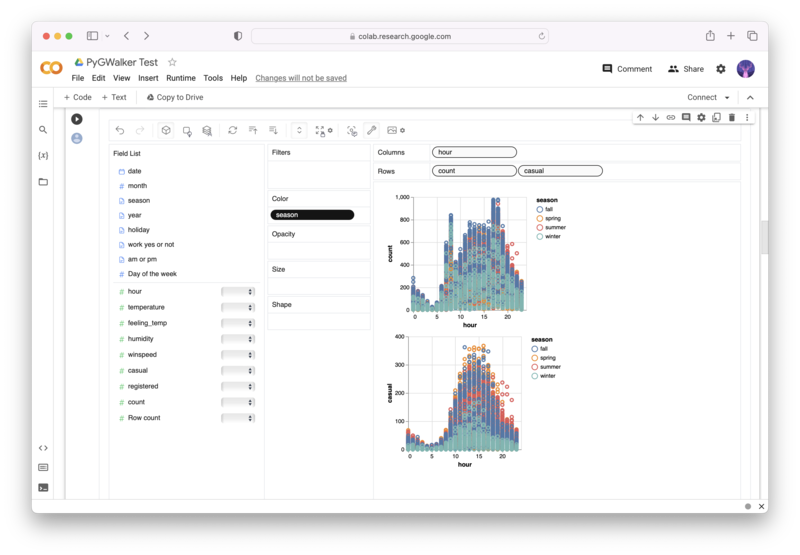
PyGWalker is an Open Source Python Project that can help speed up the data analysis and visualization workflow directly within a Jupyter Notebook-based environments.
PyGWalker (opens in a new tab) turns your Pandas Dataframe (or Polars Dataframe) into a visual UI where you can drag and drop variables to create graphs with ease. Simply use the following code:
pip install pygwalker
import pygwalker as pyg
gwalker = pyg.walk(df)
You can run PyGWalker right now with these online notebooks:
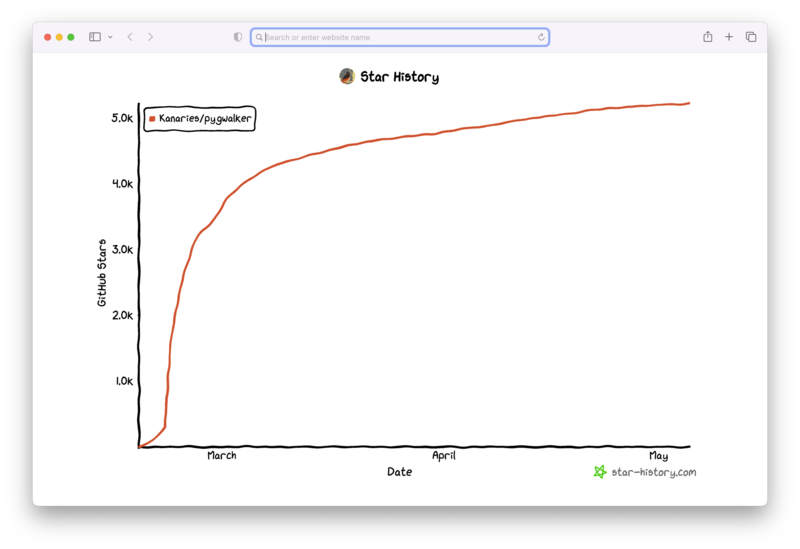
And, don't forget to give us a ⭐️ on GitHub!


