Mastering Time Series Analysis: How to Use Pandas Resample
Published on
Analyzing time series data becomes simpler with Python's powerful library - Pandas. One feature that stands out for time series analysis is the resample() function. If you're new to this or want a more comprehensive understanding, this article provides a detailed guide on how to use Pandas Resample.
Want to quickly create Data Visualizations in Python?
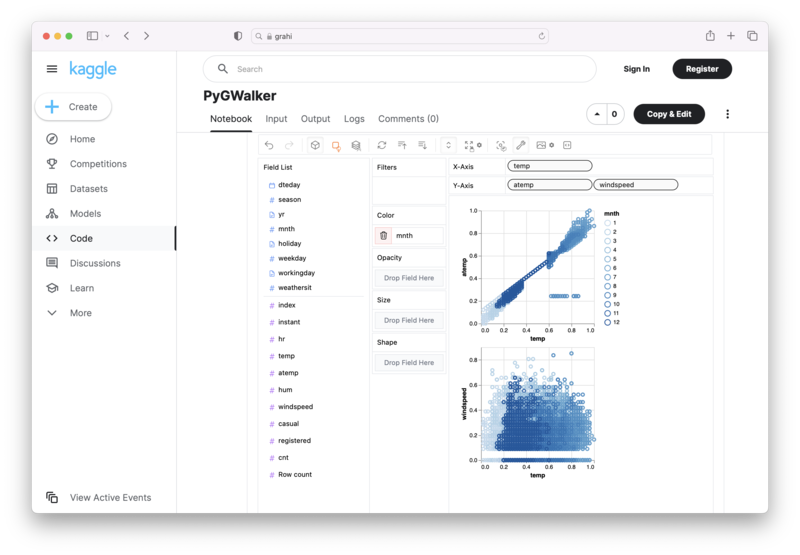
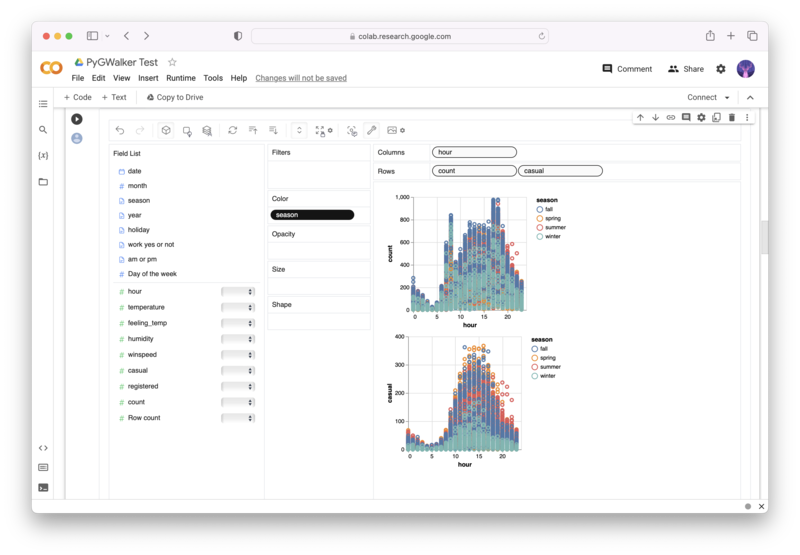
PyGWalker is an Open Source Python Project that can help speed up the data analysis and visualization workflow directly within a Jupyter Notebook-based environments.
PyGWalker (opens in a new tab) turns your Pandas Dataframe (or Polars Dataframe) into a visual UI where you can drag and drop variables to create graphs with ease. Simply use the following code:
pip install pygwalker
import pygwalker as pyg
gwalker = pyg.walk(df)
You can run PyGWalker right now with these online notebooks:
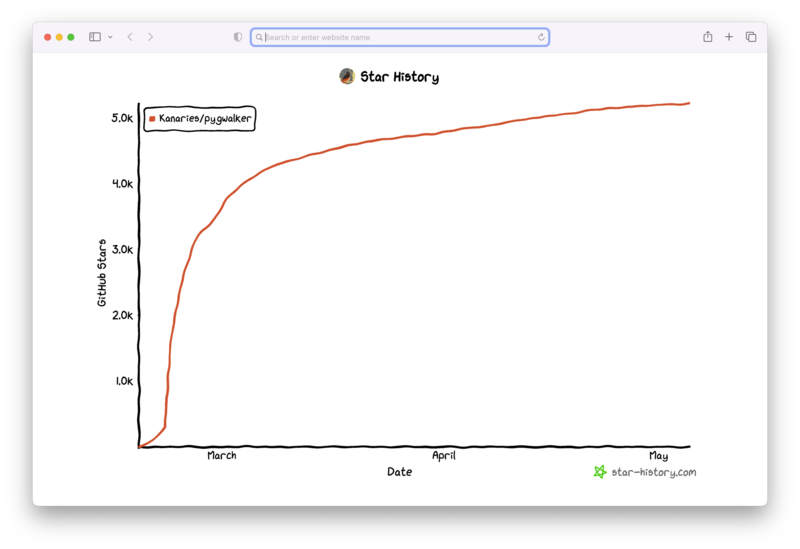
And, don't forget to give us a ⭐️ on GitHub!
The Power of Pandas Resample
Just like you can group data based on certain categories with groupby(), resample() allows grouping data at different time intervals. This unique function enhances data transformation and cleaning for time series data. But, to unlock its full potential, understanding its key parameters and the underlying concepts is essential.
Key Concepts in Resampling
Resampling can be categorized into two main types:
- Up Sampling: This involves increasing the frequency of data, e.g., converting yearly data to monthly data. More data points will now represent the time series.
- Down Sampling: This is the opposite of up-sampling, where we decrease the frequency of data, e.g., converting monthly data to yearly data.
Understanding Resample's Main Parameters
Now let's take a deep dive into the essential parameters that you need to master to use resample() effectively.
The 'rule' Parameter
The rule is an essential parameter that specifies the frequency at which you want your data resampled. Want to group your time series into 5-minute intervals or 30-minute intervals? The rule parameter has got you covered.
# Resampling data to 5 minute intervals
df.resample(rule='5T')
The 'axis' Parameter
The axis parameter (default=0) dictates whether you want to resample along rows or columns. In most time series data, you'll find that axis=0 (resampling along rows) is the common usage.
# Resampling data along columns
df.resample(rule='5T', axis=1)
The 'closed' Parameter
The closed parameter controls which side of the interval is closed, i.e., it will not include data resampled from that interval. It's particularly useful when deciding whether to include data on the edge of your time sample.
# Resampling data with right side of interval closed
df.resample(rule='5T', closed='right')
The 'label' Parameter
This parameter helps label the new bins created after resampling. A bin has two sides, the start and the end. This parameter determines how the new bins will be labeled.
# Resampling data with labels on the right
df.resample(rule='5T', label='right')
The 'convention' Parameter
The convention parameter is mainly used when up-sampling and decides where to place the data points.
# Resampling data with convention as 'start'
df.resample(rule='5T', convention='start')
There are more parameters to explore, but these form the foundation to effectively utilize the resample function.
Putting It All Together: Pandas Resample in Action
To consolidate your understanding, let's work through a detailed example. Imagine we have time series data with a data point recorded every 5 minutes from 10am to 11am. Now, we want
to resample this data into 15-minute intervals.
import pandas as pd

# Creating a date range
date_range = pd.date_range(start='10:00', end='11:00', freq='5T')

# Creating a random DataFrame
df = pd.DataFrame(date_range, columns=['date'])
df['data'] = np.random.randint(0,100,size=(len(date_range)))

# Setting the date column as index
df.set_index('date', inplace=True)

# Resampling the data into 15-minute intervals
resampled_data = df.resample(rule='15T').mean()
In this example, we first created a DataFrame with a data point every 5 minutes from 10am to 11am. Then, using resample(), we resampled the data into 15-minute intervals, taking the mean of the data points falling into each interval.
Mastering the art of resampling can bring significant improvements to your time series analysis skillset. Don't hesitate to experiment with different parameters and techniques to understand their impact better.


