How to Easily Summarize Pandas Dataframes
Published on
Pandas is a powerful tool in the data scientist's toolbox, particularly when it comes to the task of summarizing dataframes. Understanding these methods not only helps you digest large datasets but also enables you to deliver insights more effectively. Here, we'll explore the different functions used for this purpose, providing numerous examples for clarity.
We'll be using the Supermarket Sales dataset from Kaggle for demonstration purposes.
# Import library
import pandas as pd

# Import file
ss = pd.read_csv('supermarket_sales.csv')

# Preview data
ss.head()
Want to quickly create Data Visualizations in Python?
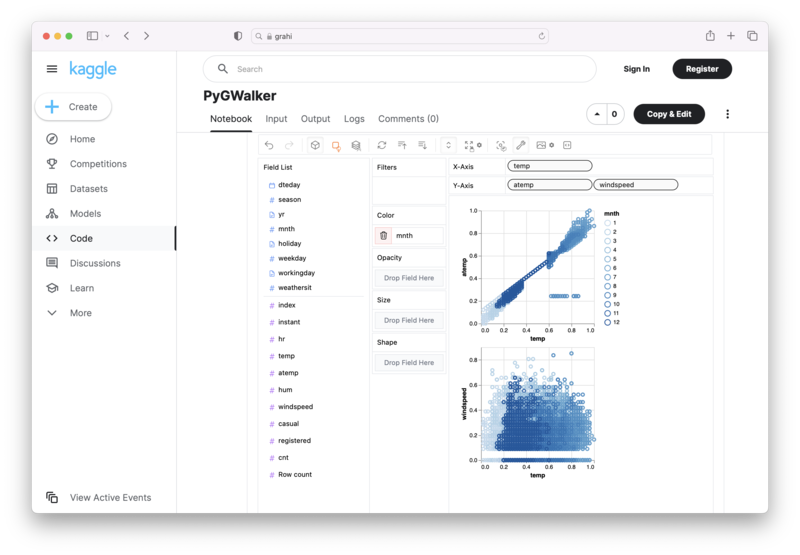
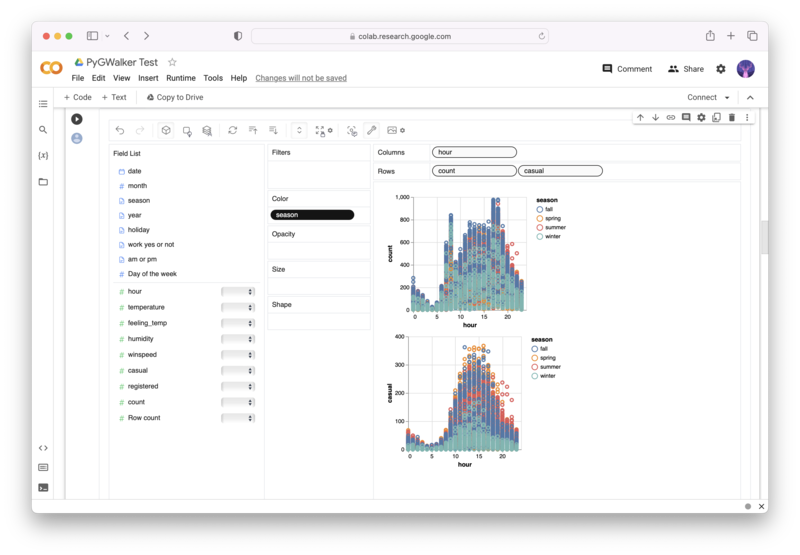
PyGWalker is an Open Source Python Project that can help speed up the data analysis and visualization workflow directly within a Jupyter Notebook-based environments.
PyGWalker (opens in a new tab) turns your Pandas Dataframe (or Polars Dataframe) into a visual UI where you can drag and drop variables to create graphs with ease. Simply use the following code:
pip install pygwalker
import pygwalker as pyg
gwalker = pyg.walk(df)
You can run PyGWalker right now with these online notebooks:
And, don't forget to give us a ⭐️ on GitHub!
Concise Summary with info()
The info() method provides a concise summary of a dataframe. It's especially helpful during data cleaning, as it shows record counts, column names, data types, index range, and memory usage.
ss.info()Descriptive Statistics with describe()
describe() generates descriptive statistics that give you a look at the dispersion and shape of a dataset's distribution, excluding NaN values.
ss.describe()The default results are for numeric types, but the include parameter can show stats for different data types in the dataframe.
ss.describe(include=['object', 'int'])Unique Value Counts with value_counts()
value_counts() returns counts of unique values for a specified series, excluding NaN values by default.
ss['City'].value_counts()Count Distinct Observations with nunique()
The nunique() function counts distinct observations and can be used for both a dataframe or a series.
ss.nunique()Sum of Values with sum()
sum() returns the sum of the values for the requested axis and works with both dataframes and series.
ss.sum(numeric_only=True)Number of Non-NA/null Observations with count()
The count() function returns the number of non-NA/null observations. It can be applied to both dataframes and series.
ss.count(numeric_only=True)Min, Max, Mean, and Median
These functions (min(), max(), mean(), and median()) return the minimum, maximum, mean, and median of the values respectively.
ss.max()
ss.min()
ss.mean()
ss.median()
Apply Multiple Aggregation Operations with agg()
The agg() function allows you to apply more than one aggregation operations to the same dataset over the specified axis.
ss.agg(['count', 'min', 'max', 'mean'])Grouping Data with groupby()
groupby() allows you to group data with the same values into summary rows by applying aggregate functions like sum, max, min.
ss.groupby('City').sum()
ss.groupby(['City', 'Customer type']).sum()
To group by a specific value and also apply more than one type of aggregation to the same dataset, you can use the agg() function.
ss.groupby('City').agg({'Total': ['count', 'min', 'max', 'mean'], 'Rating': 'mean'})Conclusion
Summarizing Pandas dataframes might seem complex at first glance, but with a firm grasp of these techniques, you can unlock the full potential of your datasets. By mastering these methods, you can streamline your data analysis process and deliver insights in a clear, concise manner.


