A Comprehensive Guide: How to Use Pandas Rank Effectively
Published on
Pandas, a data manipulation and analysis library in Python, provides a versatile tool, rank(), which is pivotal in many data analysis scenarios. This guide provides a detailed understanding of how to use Pandas Rank to elevate your data handling skills to new heights.
Want to quickly create Data Visualizations in Python?
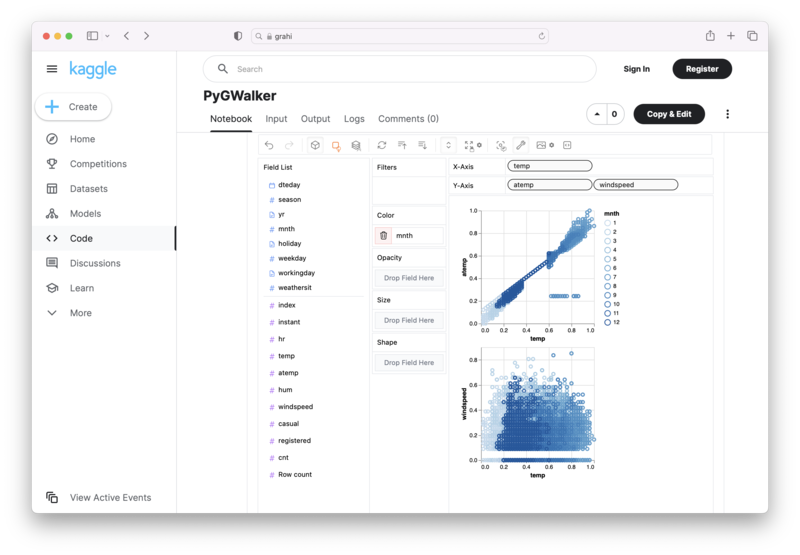
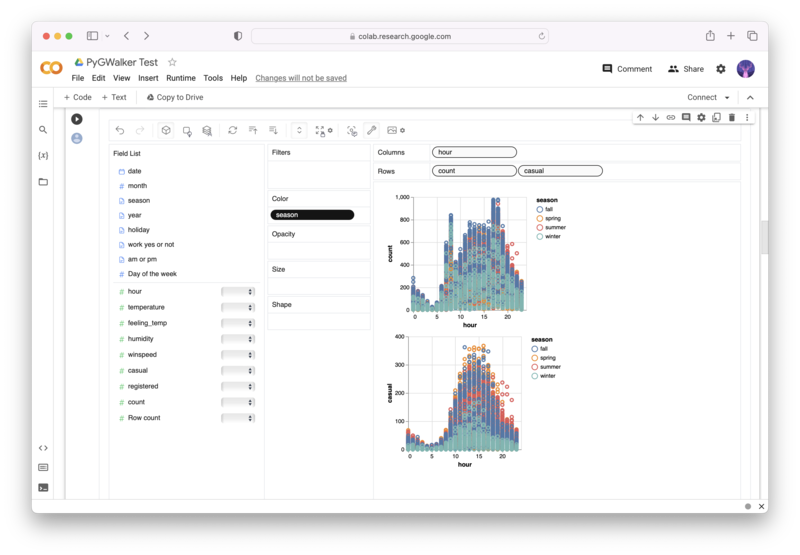
PyGWalker is an Open Source Python Project that can help speed up the data analysis and visualization workflow directly within a Jupyter Notebook-based environments.
PyGWalker (opens in a new tab) turns your Pandas Dataframe (or Polars Dataframe) into a visual UI where you can drag and drop variables to create graphs with ease. Simply use the following code:
pip install pygwalker
import pygwalker as pyg
gwalker = pyg.walk(df)
You can run PyGWalker right now with these online notebooks:
And, don't forget to give us a ⭐️ on GitHub!
Understanding the Concept of Pandas Rank
Pandas Rank computes the rank of your data point within a dataset. This function is incredibly beneficial for sorting, filtering, or identifying specific positions within a dataset. Fundamentally, there are two ways to use it:
- Ranking data within the entire DataFrame.
- Ranking data within specific subgroups using group by function.
To better grasp the utility of the rank() function, let's deep-dive into its main components: Rank Order and Method.
Rank Order
Rank Order is determined by the ascending parameter in the rank() function. If ascending=True, the rank starts from the lowest values upwards. Thus, lower values have lower ranks and vice versa. However, if you want the highest value to have a rank of 1, you should set ascending=False.
Method
The method parameter in the rank() function decides how to handle data points of the same value. There are several ways to go about it:
average: Takes the average rank of the group and applies it to all items.min: Applies the lowest rank of the group to all items.max: Assigns the highest rank of the group to all items.first: Assigns ranks in the order the data points appear in the DataFrame or Series.dense: Similar tominbut the rank increases by only +1 between groups.
Let's illustrate this with an example:
import pandas as pd

# Sample DataFrame
df = pd.DataFrame({'A': [1, 2, 2, 3, 4],
                   'B': [5, 6, 7, 8, 8],
                   'C': [9, 10, 10, 11, 12]})

# Applying rank
df['A_rank'] = df['A'].rank(method='min')
df['B_rank'] = df['B'].rank(method='max')
df['C_rank'] = df['C'].rank(method='dense')

print(df)
Mastering Rank Parameters
Understanding the parameters of the rank function is crucial to handle data accurately. Here are some essential parameters:
axis: Default is 0, which means ranking is done by rows. If you want to rank by columns, setaxis=1.numeric_only: Default is True, which means it will only rank numeric columns. If you set it to False, it will also rank strings.pct: Default is False. If set to True, this will normalize the ranks between 0 and 1.
Leveraging Rank with Group By
You can also use .rank() as an aggregate function in conjunction with the groupby() function. This enables you to compute ranks specific to each subgroup in your DataFrame.
Here's a simple example:
import pandas as pd

# Sample DataFrame
df = pd.DataFrame({'Group': ['A', 'B', 'A', 'B', 'A', 'B'], 'Value': [20, 25, 15, 18, 22, 24]})

# Applying groupby and rank
df['Value_rank'] = df.groupby('Group')['Value'].rank(ascending=False)

print(df)
In this code snippet, we first group the DataFrame by 'Group', and then compute the rank of 'Value' within each group.
Harness the power of Pandas Rank to streamline your data analysis tasks. With hands-on practice, you can become proficient in using these features for effective data manipulation. Remember, mastering these tools is not an overnight journey but a step-by-step process.


