Matplotlib.pyplot Not Resolved From Source: Understanding and Overcoming the Issue
Published on
If you've worked with Python's data visualization libraries, you may have come across a perplexing error - 'matplotlib.pyplot not resolved from source'. This is a common issue that beginners and seasoned data scientists alike encounter when working with matplotlib, a popular plotting library in Python. In this article, we explore why this happens and how to resolve it. Moreover, we introduce a promising alternative to matplotlib - PyGWalker.
Understanding Matplotlib and the Common Issue
Matplotlib is a comprehensive, multi-platform data visualization library built on NumPy arrays and designed to work with the broader SciPy stack. It produces high-quality 2D plots and figures in a variety of formats. The following is a sample code snippet that demonstrates how Matplotlib is typically used to create a simple line plot:
import matplotlib.pyplot as plt

# Data
x = [1, 2, 3, 4, 5]
y = [1, 4, 9, 16, 25]

# Create a figure and axis
plt.figure()

# Plot data
plt.plot(x, y)

# Show the plot
plt.show()
However, in the course of using Matplotlib, you might occasionally stumble upon the 'matplotlib.pyplot not resolved from source' error. This error can create a roadblock in your data visualization tasks and is typically caused by a few key reasons.
Unpacking the 'matplotlib.pyplot Not Resolved From Source' Issue
The 'matplotlib.pyplot not resolved from source' error commonly arises due to an improperly installed Matplotlib package, a Python version that's incompatible with the installed Matplotlib version, or issues with the Python interpreter locating the Matplotlib library.
-
Improper Installation: Sometimes, the Matplotlib library might not be correctly installed in your working environment. This could be a consequence of network issues during installation or some other unknown errors.
-
Python Version Compatibility: Another potential reason could be the installed version of Python not being compatible with the version of Matplotlib. Certain versions of Matplotlib are known to have compatibility issues with specific versions of Python.
-
Interpreter Issue: The error may also appear if your Python interpreter is unable to locate the Matplotlib library. This situation could arise if the library is installed in a location not known to the interpreter, or the environment paths are not set correctly.
The Resolution: Clearing the Matplotlib Issue
Addressing the 'matplotlib.pyplot not resolved from source' error involves checking the above points of failure and correcting them accordingly.
Checking and Reinstalling Matplotlib: Ensure that Matplotlib is properly installed in your environment. If you're unsure, you could reinstall it using pip or conda. Here is a sample pip command for installing matplotlib:
pip install matplotlibPython Version Compatibility: Ensure that your Python version is compatible with the installed Matplotlib version. You may need to either update your Python or Matplotlib to a version that they both support. Use the following command to check your Python version:
python --versionInterpreter Settings: Lastly, if your Python interpreter is failing to locate the Matplotlib library, you might need to update your interpreter settings or environment variables.
However, it's worth noting that despite these suggested solutions, the issue can persist due to inherent complexities in Matplotlib's structure and dependency management. This is why considering alternatives, especially user-friendly ones like PyGWalker, can be an effective strategy to overcome such hindrances in your data visualization tasks.
Introducing PyGWalker: An Efficient Alternative
For those who are experiencing consistent issues with matplotlib or seeking a more user-friendly alternative, PyGWalker is an excellent solution. It's an open-source Python project that greatly simplifies data analysis and visualization, especially within Jupyter Notebook-based environments.
Installing and Using PyGWalker
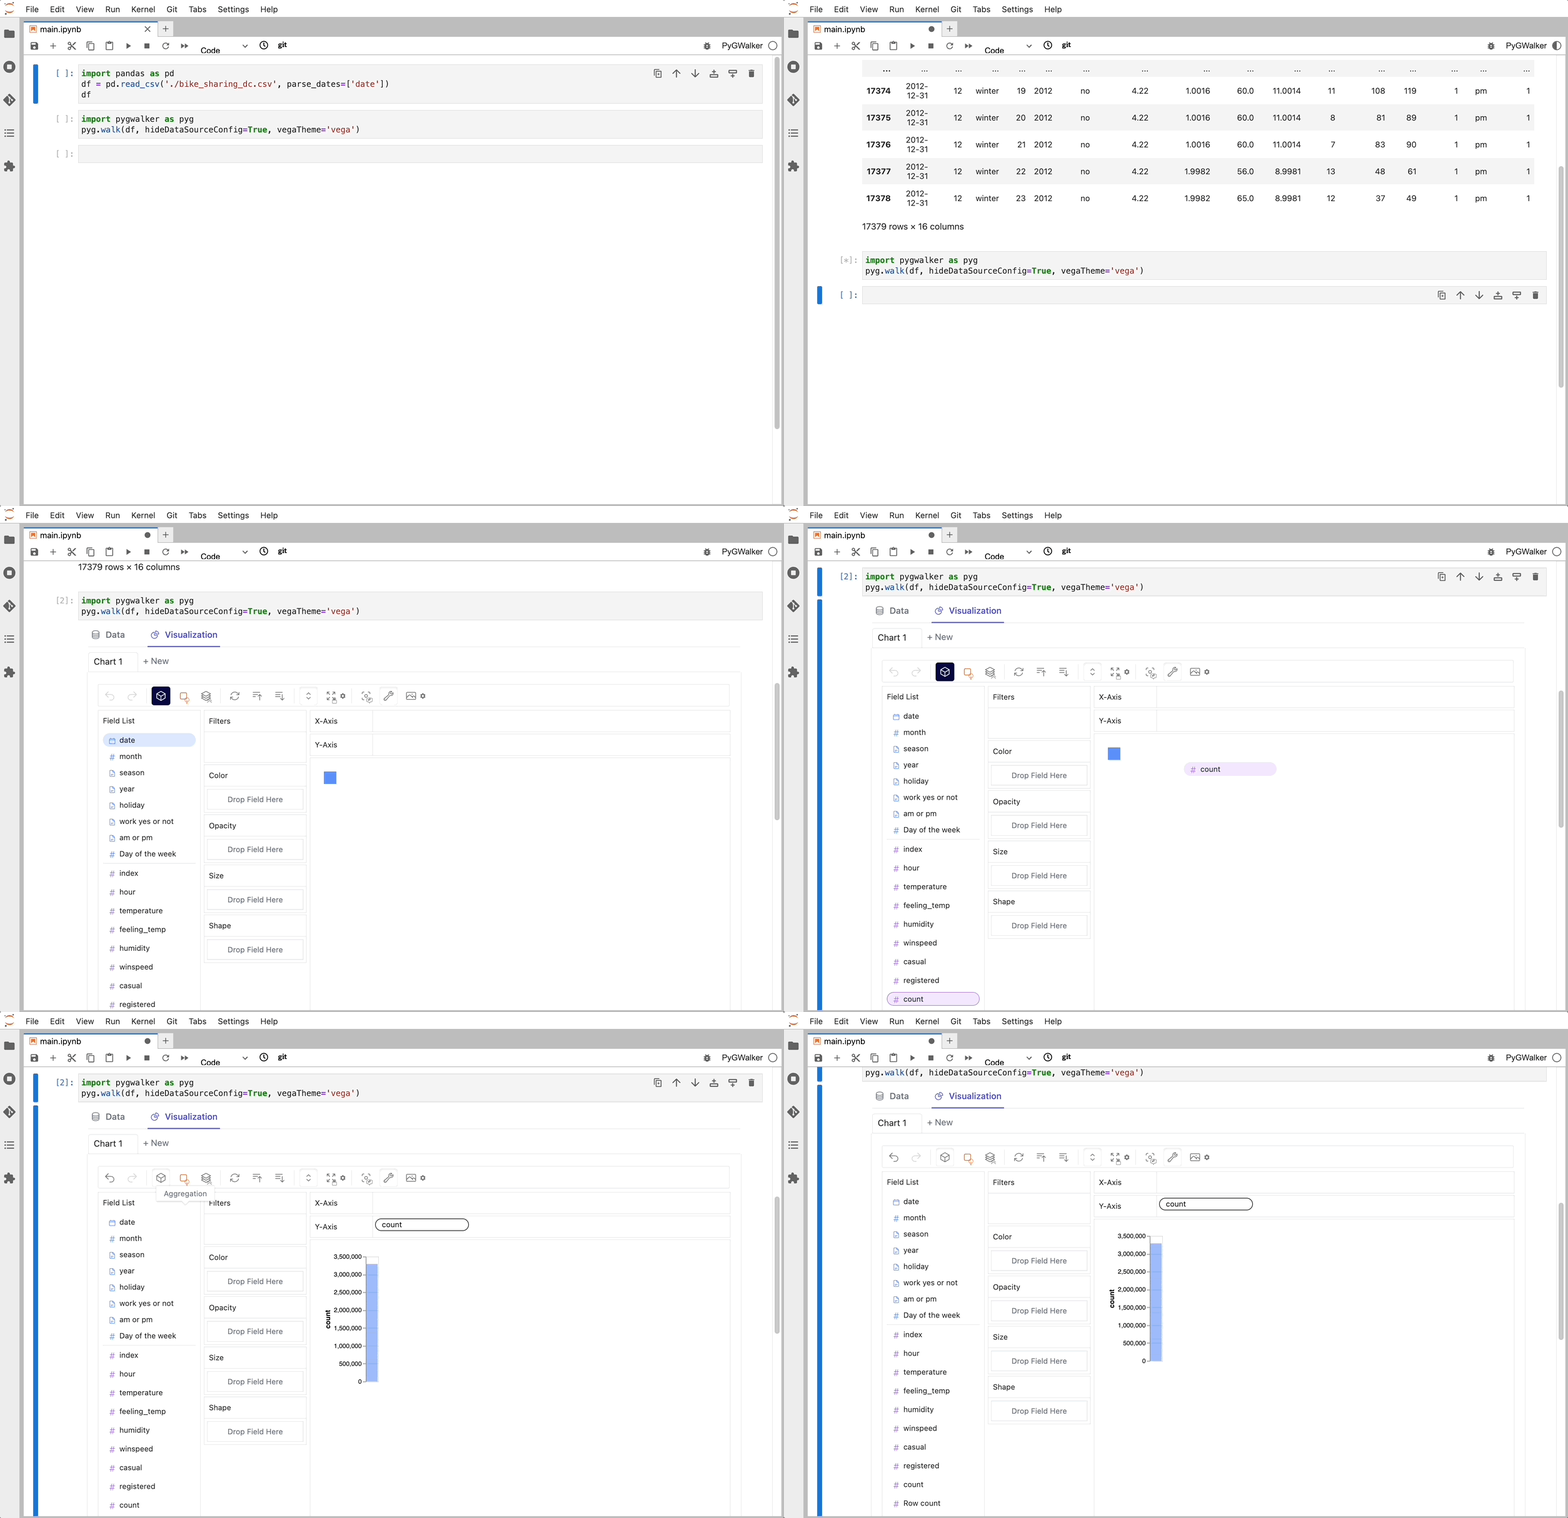
To install PyGWalker, simply use pip install pygwalker in your command line. Then, import it into your Python script using import pygwalker as pyg.
pip install pygwalker
import pygwalker as pyg
gwalker = pyg.walk(df)
That's it. Now you have a Tableau-like user interface to analyze and visualize data by dragging and dropping variables.

Visualize Your Dataframe with PyGWalker
PyGWalker can turn your Pandas or Polars Dataframe into a visual UI, allowing you to create graphs by simply dragging and dropping variables. This interactive and intuitive approach speeds up the data analysis and visualization process, making it a viable alternative to matplotlib.
You can run PyGWalker right now with these online notebooks and don't forget to give the project a star on GitHub:
- Run PyGWalker in Kaggle Notebook (opens in a new tab)
- Run PyGWalker in Google Colab (opens in a new tab)
- Give PyGWalker a star on GitHub (opens in a new tab)
Conclusion
While 'matplotlib.pyplot not resolved from source' can be a perplexing and frustrating issue, understanding the root cause and potential solutions can alleviate much of the stress associated with it. Further, the availability of innovative alternatives like PyGWalker can completely transform the data visualization process, offering an engaging, easy-to-use, and effective approach to analyzing and interpreting your data.