How to Create a Dataframe in R: A Comprehensive Guide
Published on
Dataframes are an essential tool for data manipulation and analysis in R programming language. They allow you to organize data in a tabular format with rows and columns, and each column can have a different data type. If you are new to R programming, or if you are already familiar with it but want to learn more about dataframes, this guide is perfect for you.
In this article, we will cover the basics of dataframes in R, including what they are, how to create them, and the benefits of using them. We will also address frequently asked questions and related questions and provide links to helpful resources.
Want to quickly create Data Visualizations in Python?
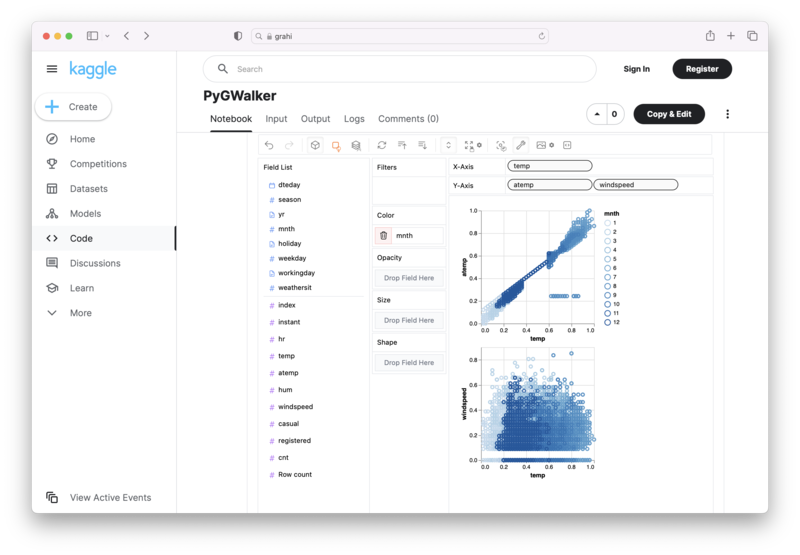
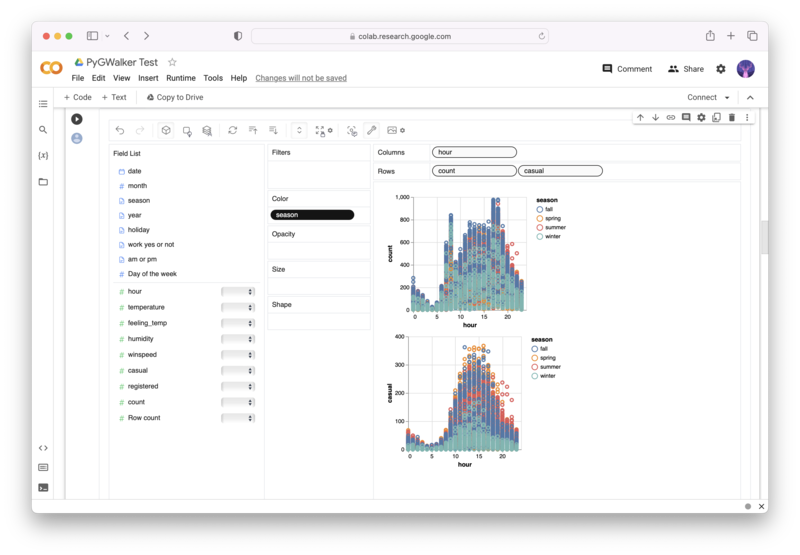
PyGWalker is an Open Source Python Project that can help speed up the data analysis and visualization workflow directly within a Jupyter Notebook-based environments.
PyGWalker (opens in a new tab) turns your Pandas Dataframe (or Polars Dataframe) into a visual UI where you can drag and drop variables to create graphs with ease. Simply use the following code:
pip install pygwalker
import pygwalker as pyg
gwalker = pyg.walk(df)
You can run PyGWalker right now with these online notebooks:
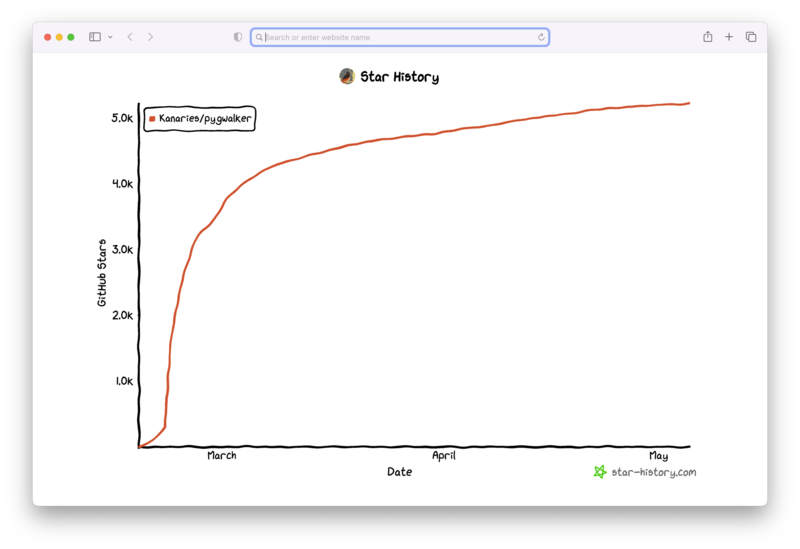
And, don't forget to give us a ⭐️ on GitHub!
What is a Dataframe in R?
A dataframe is a two-dimensional table-like object in R that stores data in rows and columns. Dataframes are similar to matrices but have some additional features that make them more flexible and powerful. For example, they can handle missing data, and each column can have a different data type, such as numeric, character, factor, or date.
One of the main advantages of dataframes is that they enable you to manipulate and analyze data in a structured, organized way. For example, you can add or remove columns, filter rows, or aggregate data using group-by functions. You can also create plots and visualizations to better understand the data.
How to Create a Dataframe in R?
To create a dataframe in R, you can use the data.frame() function. This function takes one or more vectors or lists as arguments, and each vector or list corresponds to a column in the dataframe. Here's an example of how to create a simple dataframe with three columns:
# create three vectors
x <- c(1, 2, 3)
y <- c("red", "green", "blue")
z <- c(TRUE, FALSE, TRUE)

# create a dataframe with these vectors
df <- data.frame(x, y, z)
In this example, we create three vectors x, y, and z, which correspond to the columns x, y, and z, respectively. We then use the data.frame() function to create a new dataframe df that contains these columns.
You can also create a dataframe from a CSV file using the read.csv() function. This function reads a CSV file and converts it into a dataframe in R. Here's an example:
# read a CSV file and create a dataframe
df <- read.csv("data.csv")
In this example, we read a CSV file named data.csv and create a new dataframe df from it.
What are the Benefits of Using a Dataframe in R?
Dataframes have several benefits that make them a popular choice for data manipulation and analysis in R. Here are some of the main advantages:
- Flexibility: Unlike matrices, dataframes can handle missing data and columns with different data types. This makes them more flexible and versatile for data analysis.
- Ease of Use: Dataframes are easy to create, manipulate, and visualize in R. They have a simple and consistent syntax that allows you to perform complex operations with ease.
- Compatibility: Dataframes are compatible with a wide range of R functions and libraries. You can use them for data cleaning, transformation, modeling, and visualization.
- Standardization: Dataframes provide a standardized way to organize and store data in R. This makes it easier for you to share your data with others and collaborate on projects.
- Efficiency: Dataframes are optimized for speed and memory usage in R. They are designed to handle large datasets efficiently and scale to meet your needs.
Dataframe Operaions in R
How to add a column to a dataframe in R?
To add a column to a dataframe in R, you can use the $ operator or the mutate() function from the dplyr package. Here's an example:
# add a column to a dataframe using the $ operator
df$new_column <- c(4, 5, 6)

# add a column to a dataframe using dplyr
library(dplyr)
df <- df %>% mutate(new_column = c(4, 5, 6))
How to remove a column from a dataframe in R?
To remove a column from a dataframe in R, you can use the $ operator or the select() function from the dplyr package. Here's an example:
# remove a column from a dataframe using the $ operator
df$column_to_remove <- NULL

# remove a column from a dataframe using dplyr
library(dplyr)
df <- select(df, -column_to_remove)
How to select rows from a dataframe in R?
To select rows from a dataframe in R, you can use the [] operator or the filter() function from the dplyr package. Here's an example:
# select rows from a dataframe using the [] operator
df[1:3, ]

# select rows from a dataframe using dplyr
library(dplyr)
df <- filter(df, column == "value")
How to rename columns in a dataframe in R?
To rename columns in a dataframe in R, you can use the names() function or the rename() function from the dplyr package. Here's an example:
# rename columns in a dataframe using the names() function
names(df)[2] <- "new_name"

# rename columns in a dataframe using dplyr
library(dplyr)
df <- rename(df, new_name = old_name)
How to merge dataframes in R?
To merge dataframes in R, you can use the merge() function or the join() function from the dplyr package. Here's an example:
# merge dataframes using the merge() function
df1 <- data.frame(key = c(1, 2, 3), value1 = c("a", "b", "c"))
df2 <- data.frame(key = c(2, 3, 4), value2 = c(1, 2, 3))
merged_df <- merge(df1, df2, by = "key")

# join dataframes using dplyr
library(dplyr)
joined_df <- left_join(df1, df2, by = "key")
FAQs
What is a dataframe in R?
A dataframe is a two-dimensional table-like object in R that stores data in rows and columns. Dataframes are similar to matrices but have some additional features that make them more flexible and powerful.
How do you create a dataframe in R?
To create a dataframe in R, you can use the data.frame() function. This function takes one or more vectors or lists as arguments, and each vector or list corresponds to a column in the dataframe. You can also create a dataframe from a CSV file using the read.csv() function.
What are the benefits of using a dataframe in R?
Dataframes provide several benefits, including flexibility, ease of use, compatibility, standardization, and efficiency. They enable you to manipulate and analyze data in a structured, organized way and perform complex operations with ease.
Can you have multiple data types in a dataframe in R?
Yes, each column in a dataframe can have a different data type, such as numeric, character, factor, or date.
What is the difference between a matrix and a dataframe in R?
Matrices and dataframes are both two-dimensional objects in R, but they have some differences. Matrices can only handle data of the same data type, while dataframes can handle missing data and columns with different data types. Dataframes are also more flexible and versatile for data analysis than matrices.
Conclusion
Dataframes are a powerful tool for data manipulation and analysis in R. They allow you to organize data in a structured, easy-to-use format, and perform complex operations with ease. In this guide, we covered the basics of dataframes, including what they are, how to create them, and their benefits. We also addressed frequently asked questions and related queries and provided links to helpful resources. Hopefully, this guide has given you a solid foundation for working with dataframes in R.


